[orc]An infographic published by the BJP made claims about India’s improved Global Innovation Index ranking. The infographic also makes claims about notable gains in patent applications, ICT services, exports, labour productivity etc. Here is a detailed fact-check of these claims.
The Bharatiya Janata Party (BJP) posted the following infographic on its twitter handle on 25 July 2019, along with the caption ‘India takes a huge leap of 29 places to reach 52nd rank in 2019 from 81strank in 2015 in the Global Innovation Index. Under the leadership of PM Shri @narendramodi, India continues on improving innovation including ICT services, exports, patents and R&D.’ Here is a fact check of this claim.
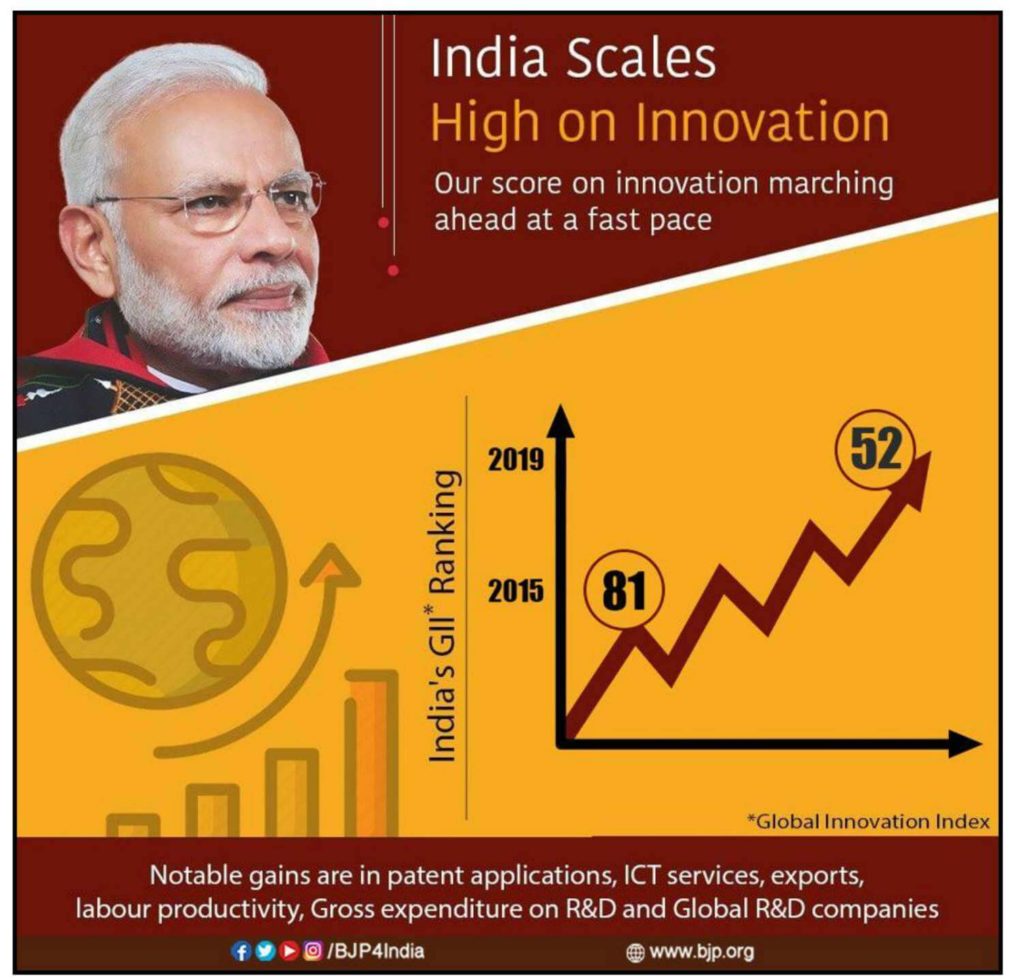
Claim: India’s Global Innovation Index Ranking has improved from 81 in 2015 to 52 in 2019 with notable gains in patent applications, ICT services, exports, labour productivity, Gross Expenditure on R&D and Global R&D companies.
Fact: The details of the Global Innovation Index Rankings reveals that India was ranked 81 in 2015 and 52 in 2019, but the ranking with respect to the individual indicators has not improved in all the cases. Moreover, this is not India’s best ranking ever. Hence, the above claim is Misleading.
What is the Global Innovation Index?
Global Innovation Index (GII) is an annual ranking which measures the innovation performance of a country’s economy based on innovation capabilities and results. GII is a joint effort among Cornell University, World Intellectual Property Organisation (WIPO) and INSEAD. This year, the 12th edition of the index was launched in India by Piyush Goyal, Minister of Commerce and Industry. The theme of GII this year is Medical Innovation.
How is GII calculated?
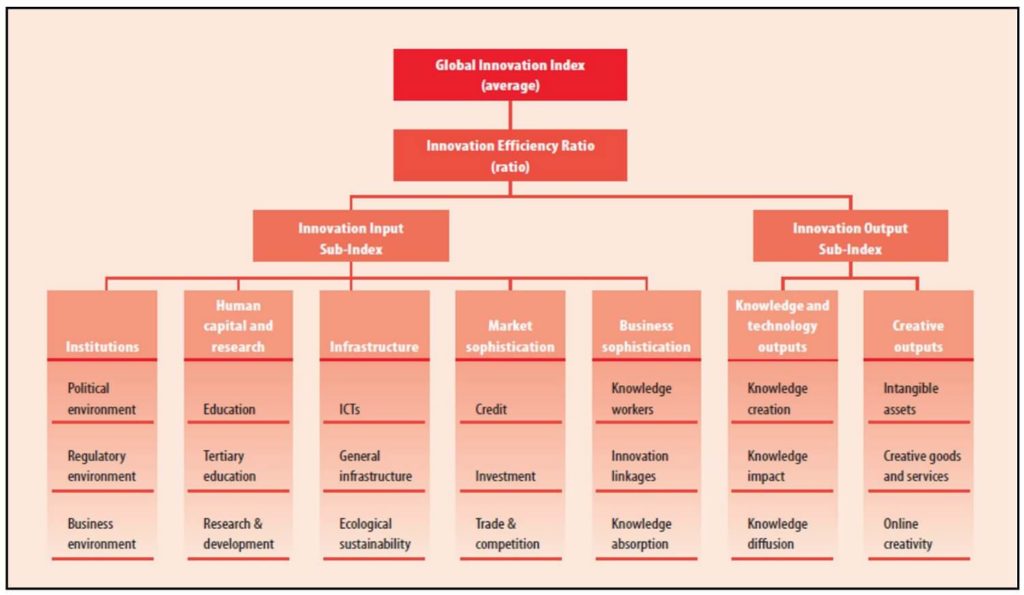
The overall GII is calculated as the simple average of Input Sub Index score and Output Sub Index Score. Innovation Input Sub Index is arrived at by taking into consideration Institutions, Human Capital and Research, Infrastructure, Market Sophistication and Business Sophistication. Similarly, the Innovation Output Sub Index Score is calculated based on Knowledge and Technology outputs and Creative outputs. Each of these seven pillars is further subdivided into three sub pillars which have individual indicators associated with them based on which GII is calculated.
What is the difference between Global Innovation Index 2015 and 2019?
The GII theme in 2015 was ‘Effective Innovation Policies for Development’- where an attempt was made to identify successful policy intervention in 141 economies across the globe. The theme for the GII 2019 is ‘Creating Healthy Lives- the Future of Medical Innovation’- where focus has been on improving healthcare through medical innovations, both technological and non-technological in 129 economies. The 2015 GII was calculated on the basis of 79 indicators whereas in 2019, a total of 80 indicators were used.
India’s position in the annual ranking since 2007 is in the following chart. The high variation in the ranking can be attributed to the modifications made to the methodology for calculating the ranks. India’s best rank so far was in 2007 when it was ranked 23rd out of 107 countries.
The GII ranking involved a different number of countries each year. The ranking was done for 107 countries in 2007 which increased to a high of 143 in 2014. In 2019, a total of 129 countries were ranked.
Has India’s ranking improved in the last few years with respect to the Individual Indicators?
While India was ranked 81 in 2015, India’s rank in 2019 has gone up to 52, an improvement of 29 positions. Notable gains in patent applications, ICT services, exports, labour productivity, Gross Expenditure on R&D and Global R&D companies have been claimed to be made under the NDA government. Here, we take a closer look.
What about Patent applications?
The measure of ‘Patent families filed in more than two offices’ is an indicator of Business Sophistication while Patent applications by origin and Patent Cooperation Treaty (PCT) applications by origin are indicators under the pillar of ‘Knowledge and Technology Output.’
Patent families filed in two offices is the number of patent families filed by residents in at least two offices (per billion PPP $GDP). By patent family, reference is made to a set of interrelated patent applications filed in one or more countries/jurisdictions for the same invention. In 2015, the calculation was done including those filed in minimum three offices.
Patent applications by origin (Domestic resident patent) refers to the number of resident patent applications filed at a given national or regional patent office (per billion PPP$ GDP).
PCT applications by origin is the number of patent applications filed by residents (per billion PPP$ GDP) through the WIPO-administered Patent Cooperation Treaty (PCT).
India’s Ranking: The ranking on the basis of number of PCT applications filed in India has increased from 49 in 2015 to 51 in 2019. Further, difference in methodology with respect to patent families could have influenced the ranking. The ranking with respect to the Domestic Resident Patent has improved by one position and the ranking in patent families filed has improved by 6, from 52 in 2015 to 46 in 2019.
Information and Communication Technologies services
The report also highlighted the Government’s online service and e-participation under Information and Communication Technologies (ICT) as strengths. At the same time, access and use of ICTs have been identified as weaknesses.
How are these indicators are calculated?
Use of ICT– weights Percentage of individuals using the Internet; Fixed (wired)-broadband Internet subscriptions per 100 inhabitants and active mobile-broadband subscriptions per 100 inhabitants at 33% each.
ICT Access– weights Fixed telephone subscriptions per 100 inhabitants; Mobile cellular telephone subscriptions per 100 inhabitants; International Internet bandwidth (bit/s) per Internet user; Percentage of households with a computer and Percentage of households with Internet access at 20% each.
Government’s Online Service Index– Measures government’s use of ICT in delivering public services at national level with the help of an Online Service Questionnaire which consisted of a list of 140 questions assessed by UN volunteers.
Online e-participation- calculated as E-Participation Index, it reflects the e-participation mechanisms that are deployed by the government as compared to all other countries.
India’s ranking in each of these categories in 2015 & 2019 is as follows.
India’s Ranking: India’s ranking has improved substantially in all of these indicators. The greatest improvement was seen in Government Online Service where the ranking improved from 57 in 2015 to 9 in 2019. Even in e-participation, ranking has improved from 40 in 2015 to 15 in 2019. However, India’s rank is still above 100 in both ICT use & ICT access.
Exports
From the report, there are four main export types which serve as indicators in the Index. These are high-tech exports and ICT service exports which fall under the pillar of ‘Knowledge and Technology Outputs’ and Cultural and Creative services exports and Creative good exports which fall under the pillar of ‘Creative Outputs’. The definition of each of these export types is the following.
High-tech exports- net high-tech exports as the percentage of total trade have been considered in the ranking. It is calculated as high-technology exports minus re-exports as percentage of total trade.
ICT services exports is found out as the Telecommunications, computers, and information services exports as percentage of total trade
Cultural and Creative services exports is calculated in terms of percentage of total trade and includes information services, advertising, market research, cultural and recreational services and more.
Creative good exports are determined as the total value of creative goods exports, net of re-exports (current US$) over total trade. Creative goods are those which are defined by UNESCO Framework in 2006 which include arts and craft and cultural goods.
India’s ranking in 2015 & 2019 each of these categories is as follows
India’s Ranking: India’s ranking has improved in the ‘Cultural & creative services exports’ from 59 in 2015 to 39 in 2019. In the other categories, India’s rank has deteriorated. India has retained the top position in the ICT exports.
Labour Productivity
The labour productivity is be measured from ‘growth rate of GDP per person engaged’. It is defined as output per unit of labour input. India was ranked 38 in 2015. In 2018 and 2019, labour productivity has improved and India’s ranking is 4.
Gross expenditure on Research and Development
Calculated as the total domestic intramural expenditure (Total expenditure for R&D within a statistical unit or sector of economy during a specific period) on research and development during a given period as a percentage of GDP, the indicator is used to determine the performance of R&D in a country. India was ranked 42 in 2015, 52 in 2018 and 50 in 2019. Hence, India’s rank has deteriorated in this aspect compared to 2015.
Global Research and Development Companies
This indicator was not available in the 2015 report. In the 2019 report, India has been ranked 15 based on the average expenditure by the top 3 companies in Research and Development. The 2018 report ranked India at 18. Thus, there has been an improvement in India’s rank.
Overall, while India’s rank has improved, it has not improved on all the indicators and this is not India’s best rank ever.


1 Comment
Pingback: Fact Checking Government claims on the Global Innovation Index - Fact Checking Tools | Factbase.us