[orc]A press release issued in the name of former Prime Minister Dr. Manmohan Singh on 07th May 2018 mentioned about the MSP growth rates during the UPA II and the current NDA government. We fact check the claim.
On May 7th 2018, former prime minister of India Dr. Manmohan Singh issued a press statement about development in India, speaking in the context of the Karnataka elections. In this statement, he contrasted the nation’s growth and performance in certain areas during the current NDA rule and that of the previous UPA government. One of the claims that he made was regarding the growth rate of MSP under the two governments. He said:
“Under the UPA II, the average annual MSP growth rate was 19.3%, under the NDA government; this has fallen to 3.6%”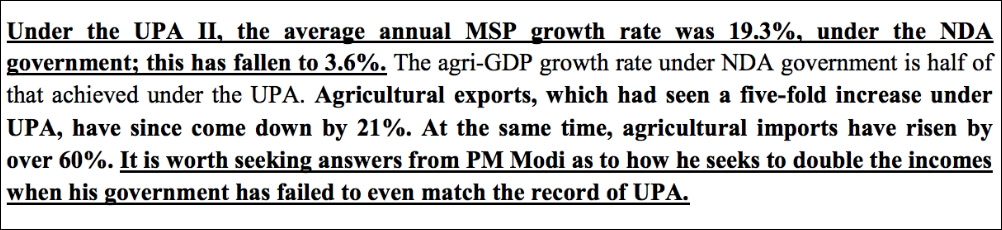 We have calculated the Minimum Support Price (MSP) growth for these respective periods and we find that there was a significant difference in the growth of MSP during the two governments, but not of the magnitude that Dr. Singh claims.
What is MSP?
The Minimum Support Price (MSP) is the price at which the government purchases crops from farmers. Irrespective of the price being offered in the market, the farmer is assured before the sowing season that they will receive at least this minimum amount for the crops they grow. It provides a safety net to farmers, which can be useful due to the volatility of prices in the agricultural market. By claiming that under the UPA government the MSP growth rate was higher, Dr. Singh is implying that the policies of the past UPA government were more favorable to farmers than that of the current NDA government. But does data support this?
UPA II Vs NDA – Who did better?
There is no single value of MSP for a year, as it is announced for each particular crop. Data about different MSPs announced for each of the 25 crops from 2008 to 2018 was collated from the Directorate of Economics and Statistics, Department of Agriculture’s website. The percentage increase from one year to the next for each crop was calculated for every year under the current NDA and UPA II governments. The average growth for each crop under the two periods was then found by averaging the values for the years 2009-2014 and 2014-2018. Similar data was also collated from the Reserve Bank of India’s (RBI) website. The data is given in the table below.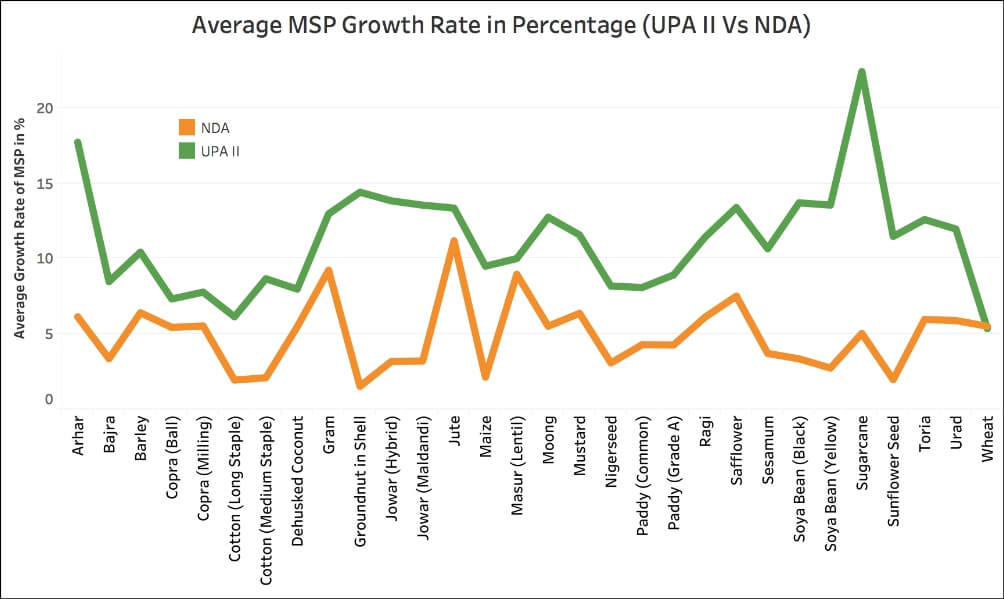
Claim Check: From the above graph and corresponding table, we can see that under the UPA II government, the average growth for each crop (except wheat) was higher than during the current NDA government. The aggregate average growth of the MSP (all crops) during the UPA II rule was 11.28%, while that under the NDA government has been 4.91%. These numbers were calculated by taking the average of average growth rates of all the crops during these periods. This results in a difference of 6.48 percentage points as opposed to what was claimed by Dr. Singh of 15.7 percentage points. Only in the case of Sugarcane was the difference between growth of MSP in two governments 15 percentage points.
| Average MSP Growth Rate | ||
|---|---|---|
| Crop | UPA II | NDA |
| Paddy (Common) | 8.09 | 4.30 |
| Paddy (Grade A) | 8.93 | 4.27 |
| Jowar (Hybrid) | 13.84 | 3.18 |
| Jowar (Maldandi) | 13.55 | 3.22 |
| Bajra | 8.48 | 3.36 |
| Maize | 9.50 | 2.14 |
| Ragi | 11.43 | 6.12 |
| Arhar | 17.73 | 6.15 |
| Moong | 12.75 | 5.52 |
| Urad | 11.97 | 5.90 |
| Cotton (Medium Staple) | 8.67 | 2.10 |
| Cotton (Long Staple) | 6.15 | 1.95 |
| Groundnut in Shell | 14.41 | 1.53 |
| Sunflower Seed | 11.48 | 1.97 |
| Soya Bean (Black) | 13.71 | 3.36 |
| Soya Bean (Yellow) | 13.56 | 2.75 |
| Sesamum | 10.66 | 3.71 |
| Nigerseed | 8.19 | 3.09 |
| Wheat | 5.36 | 5.52 |
| Barley | 10.44 | 6.41 |
| Gram | 12.97 | 9.24 |
| Masur (Lentil) | 10.01 | 8.97 |
| Mustard | 11.58 | 6.37 |
| Safflower | 13.40 | 7.52 |
| Toria | 12.60 | 5.97 |
| Copra (Milling) | 7.78 | 5.54 |
| Copra (Ball) | 7.33 | 5.44 |
| Dehusked Coconut | 7.98 | 5.48 |
| Jute | 13.36 | 11.19 |
| Sugarcane | 22.42 | 5.04 |
What about UPA I Vs UPA II Vs NDA?
Similar calculations were done using the RBI data for seven food crops. Using this data, we also see the growth during the UPA I rule, which Dr. Singh did not mention. We find that even during the UPA I rule, the MSP growth was mostly greater than that during the current NDA rule. In the case of gram, although UPA II has a higher average growth rate, UPA I does not. In the case of five(5) crops, UPA I has higher average growth rates than UPA II as well.
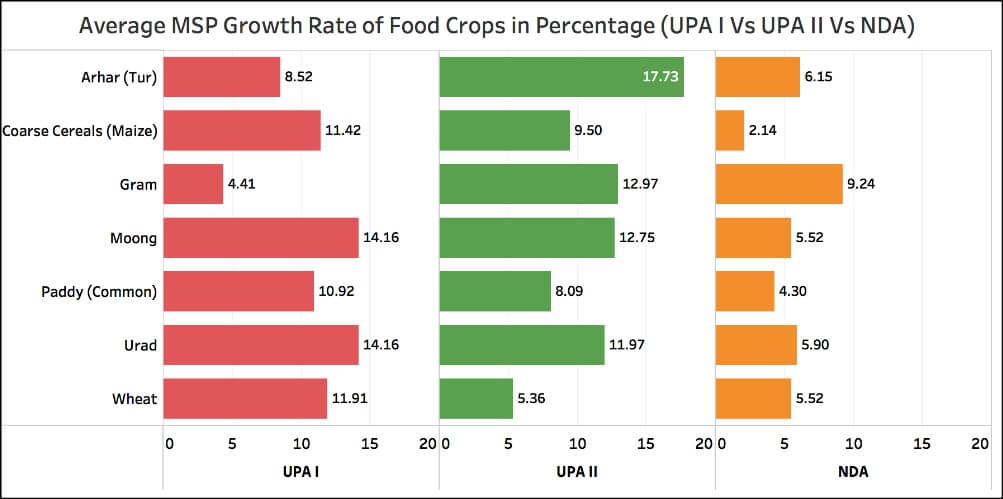
Claim Check: Although the magnitude of the difference is less than what is claimed, there is still a significant difference in the growth of MSP during the UPA and NDA governments.

Featured Image: By Ramon (Flickr) [CC BY-SA 2.0 (Via Wikipedia Commons)]

