[orc]The Congress party’s official twitter handle made a claim recently that compared the average annual average export growth rate between 2009-14 and 2014-18. Here is a Fact Check
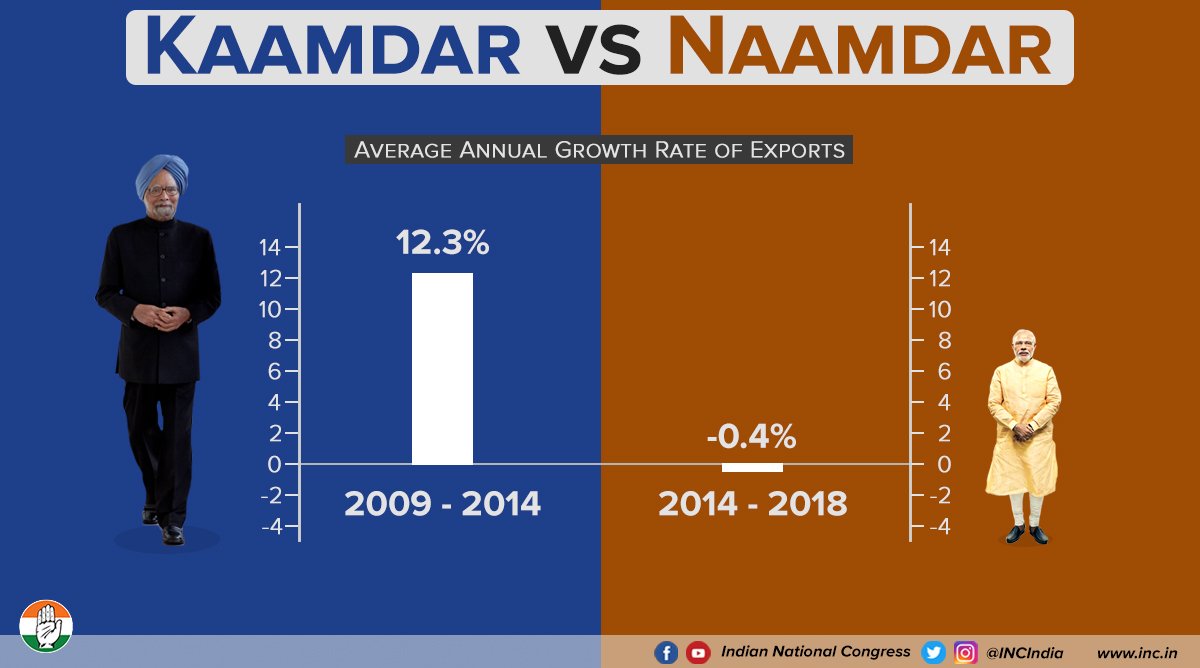
The Indian National Congress Twitter page has been sharing many infographics and claims about the state of India under the NDA government. They also include comparisons of performance under NDA and UPA II governments. One of the infographics shared by the official party handle on June 30, 2018 compares the growth of exports under Manmohan Singh and Narendra Modi, and claims that under the former, the average export growth was in double digits (12.3%) and under the latter it was negative (-0.4%).
Why Is Export Growth Important?
Exports and imports determine the Balance of Trade (BoT) of a nation. The BoT is calculated by the total value of Exports minus the total value of Imports. Because imports must be paid in foreign currency, exports play an important role in financing the imports. If imports exceed exports, the reserve of foreign currency gets depleted. Balance of Trade is important for stability of the domestic currency and also affects the exchange rate of the domestic currency. Apart from BoT, export growth is also good for boosting the country’s GDP.
Growth of economy was one of the main planks of the Modi campaign in 2014. The Congress claims that export growth has dramatically fallen under this government and that damages this image. Here is a fact check of this claim.
Average Annual Export Growth
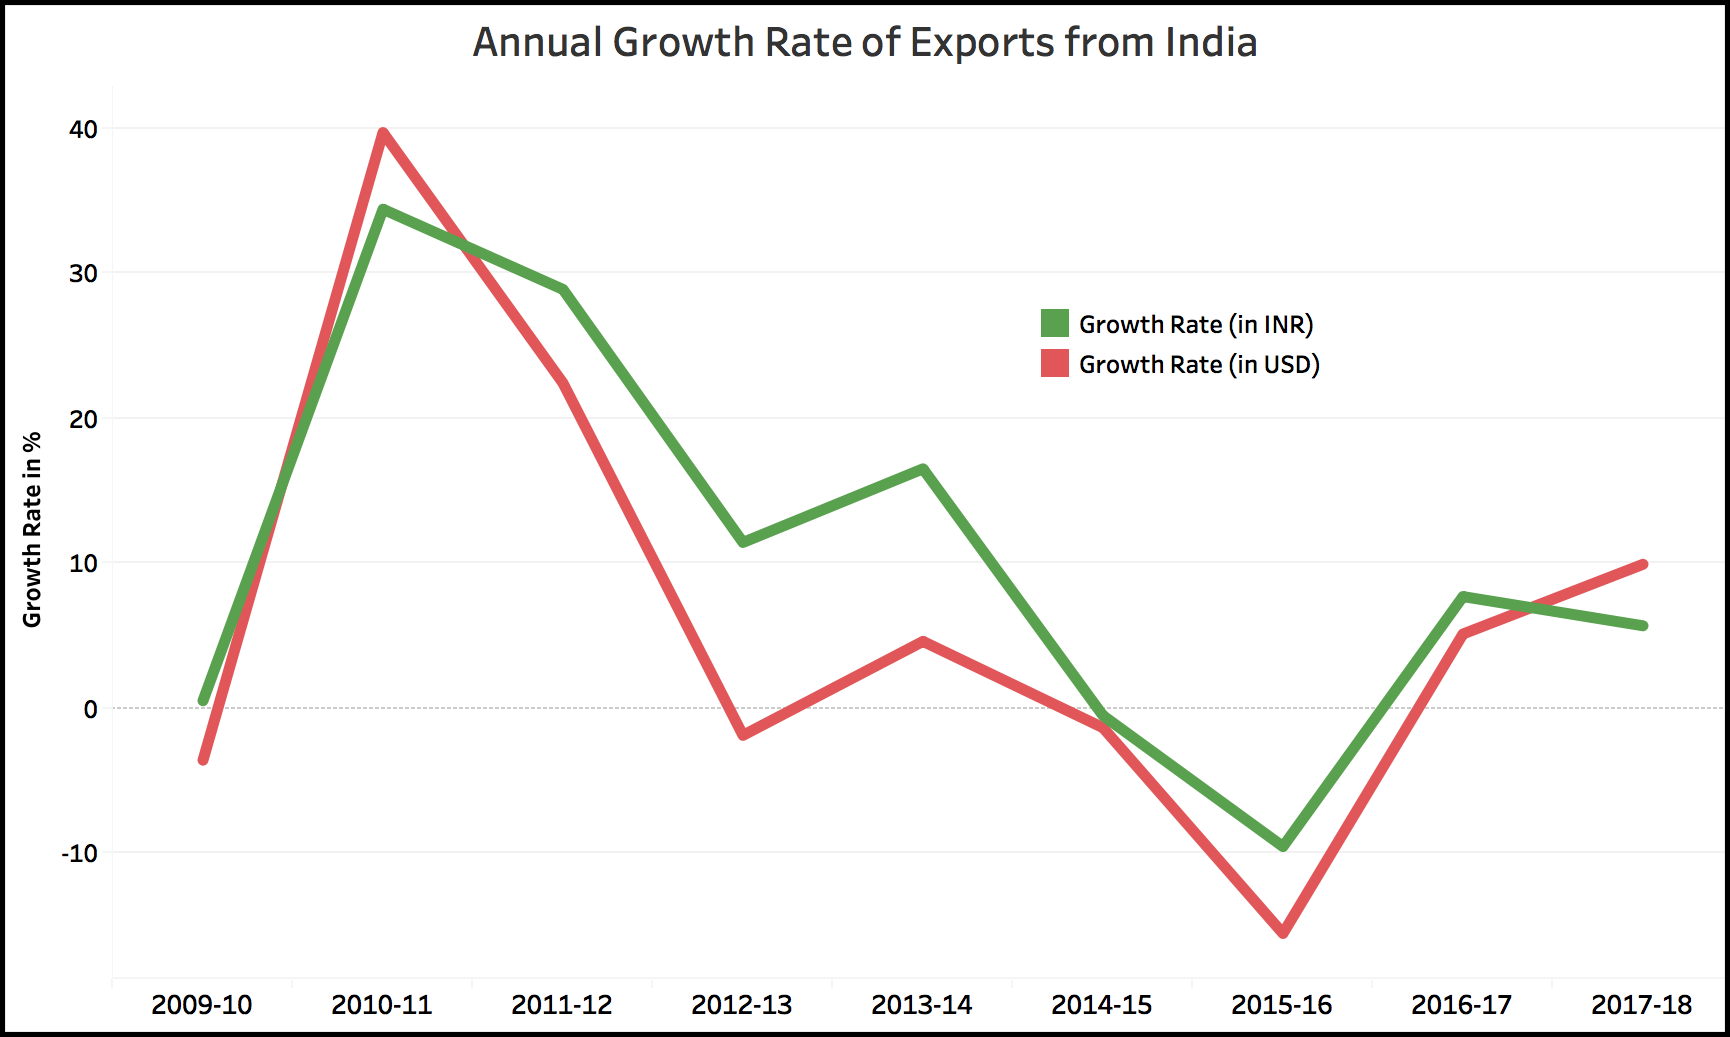
Annual export data has been collated from the Department of Commerce’s Export-Import Data Bank. These figures are available in both INR (in Rs lakhs) and USD (in $ Millions). The annual growth rate is the percentage increase from the previous year. This growth has been calculated separately for the figures in INR and in USD. The data is as follows for the years 2008-09 to 2017-18.
| Year | Exports (in Rs. Lakhs) | Exports (US $ Million) | Growth Rate in % (INR) | Growth Rate in % (USD) |
|---|---|---|---|---|
| 2008-09 | 84075505.87 | 185295.36 | ||
| 2009-10 | 84553364.38 | 178751.43 | 0.57 | -3.53 |
| 2010-11 | 113696426.38 | 249815.55 | 34.47 | 39.76 |
| 2011-12 | 146595939.96 | 305963.92 | 28.94 | 22.48 |
| 2012-13 | 163431828.96 | 300400.58 | 11.48 | -1.82 |
| 2013-14 | 190501108.86 | 314405.3 | 16.56 | 4.66 |
| 2014-15 | 189634841.76 | 310338.48 | -0.45 | -1.29 |
| 2015-16 | 171637804.58 | 262290.13 | -9.49 | -15.48 |
| 2016-17 | 184942875.55 | 275851.71 | 7.75 | 5.17 |
| 2017-18 | 195554111.53 | 303376.22 | 5.74 | 9.98 |
 When we compare the average of these values between the two time periods 2009-14 and 2014-18, we get the following.
| Time Period | 2009-14 | 2014-18 |
|---|---|---|
| Annual Average Growth Rate in % (USD) | 12.31 | -0.41 |
| Annual Average Growth Rate in % (INR) | 18.40 | 0.89 |
If we look at the annual average of export growth in USD, we find that these are equal to the figures that the Congress has quoted in the image. Thus the claim that average annual export growth was higher under the UPA government compared to the current NDA government is true.
Claim Check: The Congress’s claim that the annual average export growth rate is higher during the UPA II compared to the current NDA government is TRUE.


1 Comment
Liberty Lending Group offers personal and commercial loans with no hidden fees and no repayments penalties. The experts at Liberty Lending are ready to assist you through the process of obtaining a loan. Our application is simple, quick and hassle-free. Just apply and then browse through your pre-approved offers. Visit our website or contact us today via email @ libertylendinggroups@gmail.com or Whatsapp @ +1(202)922-8783 to learn more about our process!
Terms And Conditions apply.