[orc]Population in the 0-9 years’ age group gives a better idea of population growth since these are people born within the period of the census exercise. As per the 2011 census data, the absolute population of both Muslims & Christians in the 0-9 age group increased while the population of Hindus in this age group decreased compared to the 2001 census.
Population growth rate is a key measure to identify the increase in population over a period of time. Factly had earlier written about the population growth rates across the country at district level and among the various religious communities.
The growth of population is influenced by the number of births as well the number of deaths over a period of time, with the net value reflecting in the population growth rate. In this story, we analyse the actual number of people that are being added to the population, or those in the 0-9 age group in different parts of India as well as from different religious communities.
To measure the number of people added over a decade, we have considered the population within the age group of 0-9 years’ as per both 2001 and 2011 census, as these are born during the intervening decade.
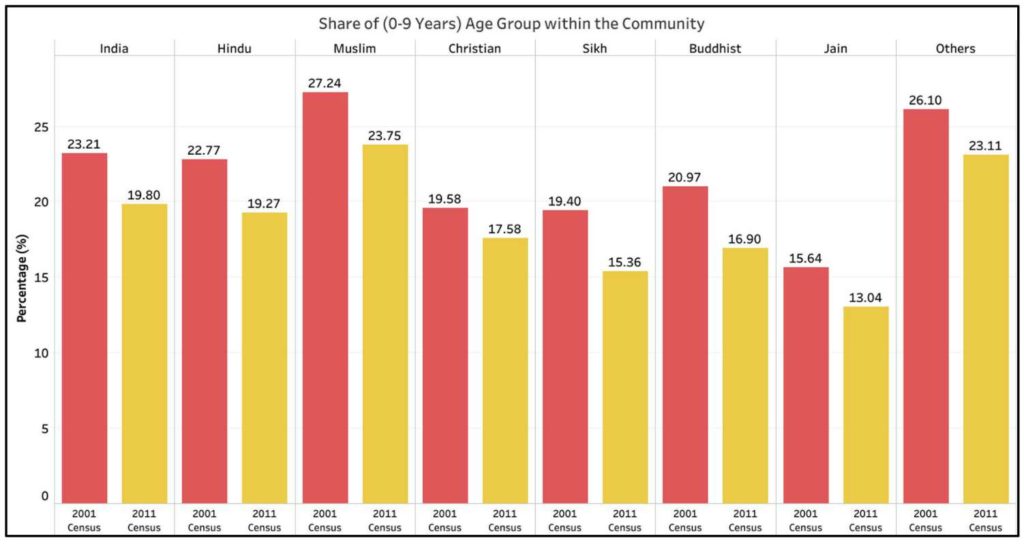
Share of population in the 0-9 Years age group declines across religious communities
The share of population within 0-9 years age group has come down in 2011 census compared to 2001 census. The share of population in the 0-9-years’ age group as per 2001 census was 23.2%, while it reduced to 19.8% as per the 2011 census. This reduction in the share of this age group is consistent across all the religious communities.
As per 2001 Census, among the Hindus, 22.8% were in the 0-9 years’ age group which reduced to 19.3% in 2011. In the case of Muslims, the share of those in the 0-9 years’ age group was 27.2% in 2001, but has reduced 23.8% as per 2011 census. The same is true among other religious communities. Of all the religious communities, as per 2011 census, the share of those in the 0-9 years age group is more than the national average of 19.8% only in the case of Muslims.
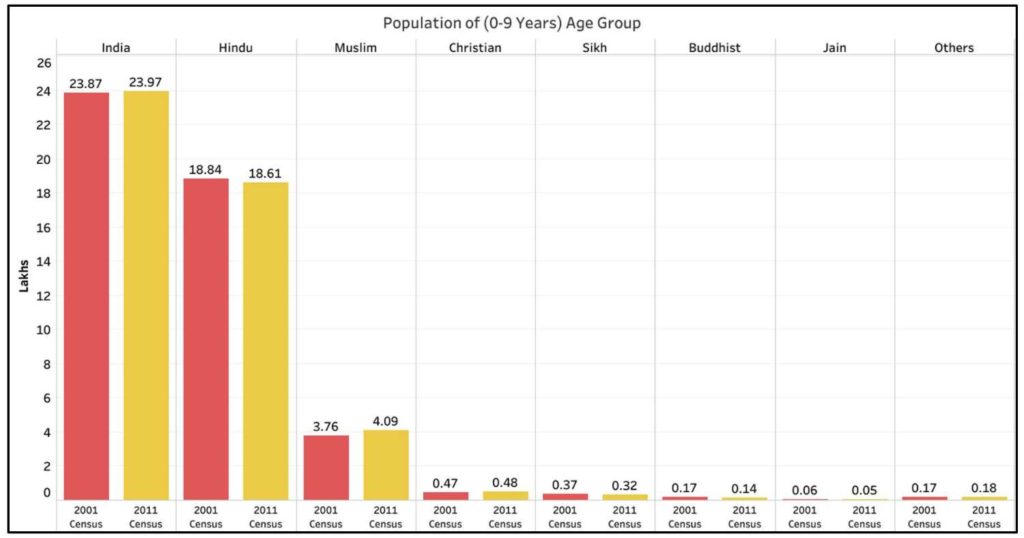
Increase in the absolute population of 0-9 age group observed among Muslims & Christians
As per the census in 2001, population within the age group of 0-9 was around 23.87 crores which increased to 23.97 crores in 2011, an increase of around 10 lakhs. This comparative increase can be attributed to the increase in the corresponding numbers among Muslims and Christians.
The population of Muslims in the 0-9 age group was 4.09 crores as per 2011 census, up from 3.76 crores as per the 2001 census, an increase 33 lakhs. Similarly, in the case of Christians, the population in the 0-9 age group as per 2001 census was 47.14 lakhs which increased to 48.9 lakhs in 2011, an increase of 1.76 lakhs.
Meanwhile, in the case of Hindus, the population in the 0-9 age group as per 2001 census was 18.84 crores which reduced to 18.61 crores in 2011, a decrease of 23 lakhs. A similar decreasing trend is observed among other religious communities.
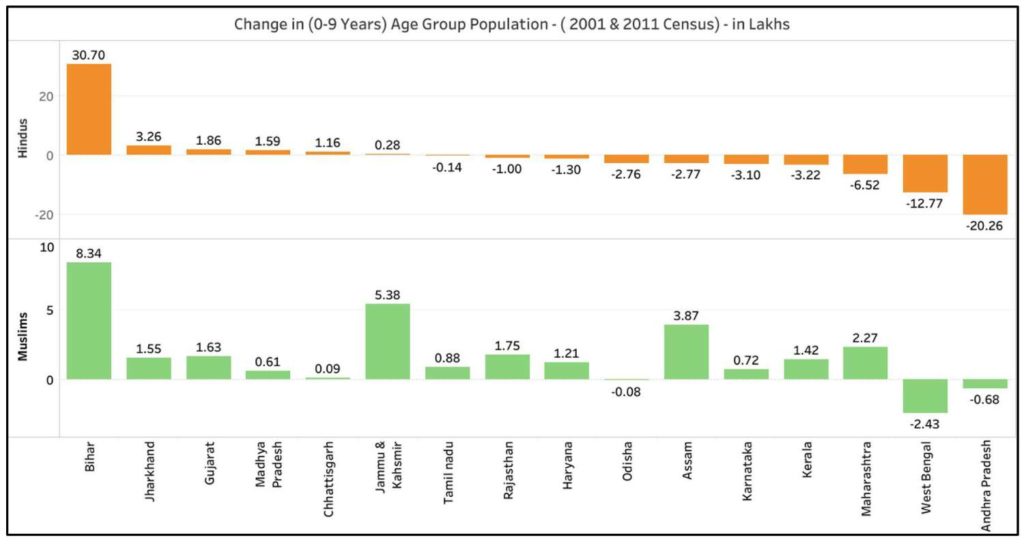
Bihar, Jharkhand, Gujarat, Madhya Pradesh witness increase in the population of 0-9 age group
Among the states, Bihar saw an exponential increase in population of 0-9 age group in 2011 census compared to that of 2001 census. As per 2001 census, the population in the 0-9-years’ age group was 2.38 crores in Bihar, which increased to 2.78 crores as per 2011 census i.e. an increase of nearly 40 Lakhs. This increase is observed across all the major religious communities within Bihar. The comparative increase in Hindu population in this age group was 30.7 lakhs and Muslim population in this age group grew by 8.33 lakhs.
In the case of Jharkhand, the population in the 0-9 age group increased by 6.12 lakhs between 2001 & 2011. Of this Hindu population increased by 3.26 lakhs and the Muslim population increased by 1.55 lakhs. Similar population increase across the communities is observed in Madhya Pradesh, Gujarat, Chhattisgarh along with Jammu & Kashmir.
West Bengal and erstwhile Andhra Pradesh are among the bigger states who saw a significant decrease in the population of 0-9 years age group. In Andhra Pradesh (including Telangana), as per 2001 census the population in this age group was 1.56 crores while it decreased to 1.35 crores as per 2011 census i.e. a reduction of 21 lakhs. Similarly, West Bengal’s population in this age group was 1.71 crores in 2001 and it decreased to 1.55 crores in 2011 i.e. decrease of 15 lakhs. The decrease in population for this age group was consistent across all the religious communities in these two states. In the case of Andhra Pradesh, 95% of this decrease is among the Hindus.
In few other states, the trend of change in population differed between the communities. In Uttar Pradesh, the population in the 0-9 age group decreased by 1.74 lakhs between 2001 & 2011. However, the population of Muslims in this age group increased by 4.71 lakhs whereas the population of Hindus decreased by 7.34 lakhs. Another such state was Assam, where there was increase of 1.19 lakh, in the population of 0-9 years’ age group, largely due to rise in Muslim population in this age group. Muslim population in this age group increased by 3.87 lakhs offsetting the decrease in Hindu population by 2.77 lakhs.
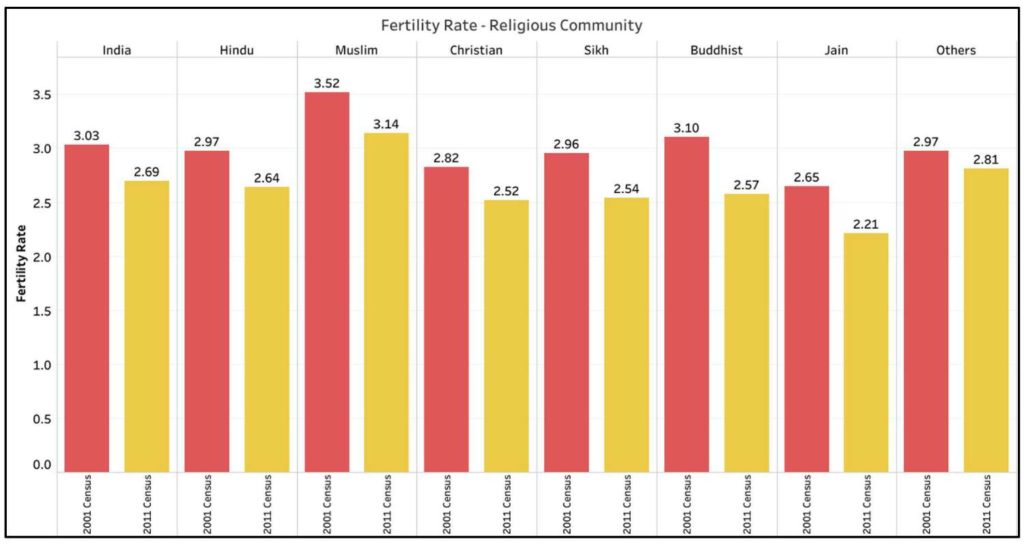
Fertility rates have reduced across communities as per 2011 census, but still highest among Muslims
The national total fertility rate or TFR among married women as per 2001 census was 3.03 while this has reduced to 2.69 by 2011 census. TFR indicates the average number of children expected to be born per woman during her entire span of reproductive period.
This decrease in the fertility rate is observed across all the religious communities. The fertility rate among the Hindus in 2001 was 2.97 which reduced to 2.64. Although, the fertility rate among the Muslim community is still the highest, the TFR among Muslims has decreased to 3.14 in 2011 compared to 3.52 in 2001.
The TFR has decreased across all the states. States like Uttar Pradesh, Madhya Pradesh, Rajasthan, Bihar and Chhattisgarh continue to have higher TFR than the national average, but even they have a reported a lower TFR compared to 2001 census. Significant change in the TFR is observed in West Bengal where it decreased by 0.51 of which the fertility rate among Hindus reduced by 0.51 and among Muslims by 0.58.
Other larger states with significant change in fertility rates are
- Maharashtra (- 0.46) – Hindu (- 0.45) & Muslim (- 0.52)
- Gujarat (- 0.34) – Hindu (-0.34) & Muslim (0.43)
- Odisha (-0.42) – Hindu ( -0.41) & Muslim (0.72)
- Chhattisgarh (-0.31) – Hindu ( -0.31) & Muslim (-0.48)
- Madhya Pradesh (-0.39) – Hindu (-0.38) & Muslim (-0.58)
Even as per the Sample Registration System (SRS) report of 2017, All-India TFR for 2015-17 reduced to 2.2 compared to 2.8 during 2005-07.
Decreasing TFR is good news, but high TFR in some states & among Muslims still a concern
As noted above, the decreasing trend in TFR across the country is good news. However, the TFR in some states & the Muslim community is still higher than the national average and also the replacement rate. Replacement rate is TFR at which women give birth to enough babies to sustain population levels. If the current decreasing trend continues, the TFR in these states may also reach the replacement levels in the near future. Decreasing fertility rates would not give rise to any presumptive change in the population dynamics.
Featured Image: Absolute population of Muslims & Christians


1 Comment
Pingback: Between 2001 and 2011, absolute population of Muslims & Christians in the 0-9 age group increased while that of Hindus decreased - Fact Checking Tools | Factbase.us