[orc]The 70th round report of NSSO on household assets & indebtedness was released recently. The average value of assets for SC & ST households is almost half the national average and almost 1/3rd the asset value of those in the ‘Others’ category
The latest National Sample Survey Office (NSSO) report on ‘Household Assets & Indebtedness among Social Groups’ was released recently. This report is part of the NSS 70th round and has data from the survey done in the year 2013. The survey findings indicate the average value of assets (AVA) of SC/ST households is almost half the national AVA.
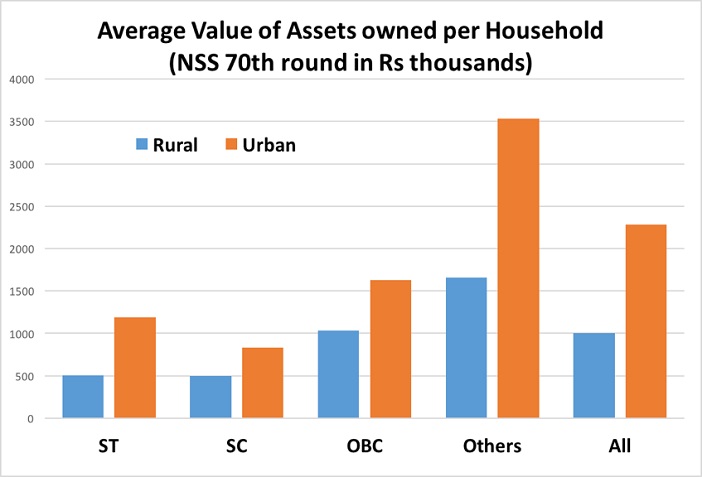
Other Households have the highest AVA
For the purpose of this round of survey, both physical and financial assets owned by households as on 30th June 2012 were taken into account. Land, building, livestock, agricultural implements and machinery and transport equipment were considered as physical assets while household durables were kept outside of the list of physical assets. Further, shares and deposits, etc., cash and kind dues receivable except bullion and ornaments (gold & jewelry) were considered as financial assets.
It is observed from the data that SC & ST households are far behind the ‘Others’ both in urban & rural areas in their AVA. In fact, the AVA of SC & ST households is almost 1/3rd of the ‘Others’ in both urban & rural areas. The AVA for ST households was almost half the national average (when all the groups are considered) in both urban & rural areas. The AVA is lowest for SC households in urban as well as rural areas. For both STs and Others, the AVA in urban areas is more than double the AVA in rural while for SCs & OBCs, the AVA in urban is around 60% more than in rural areas.
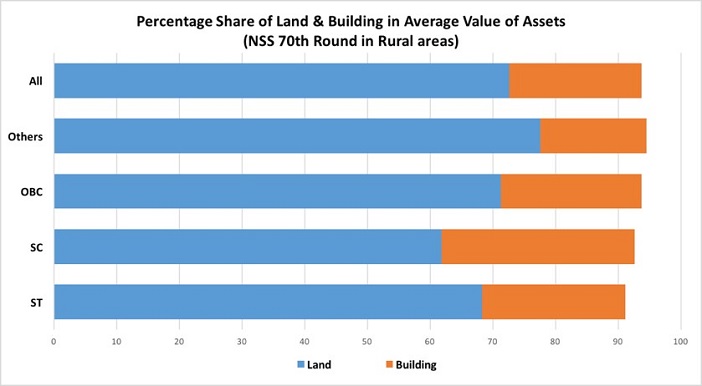
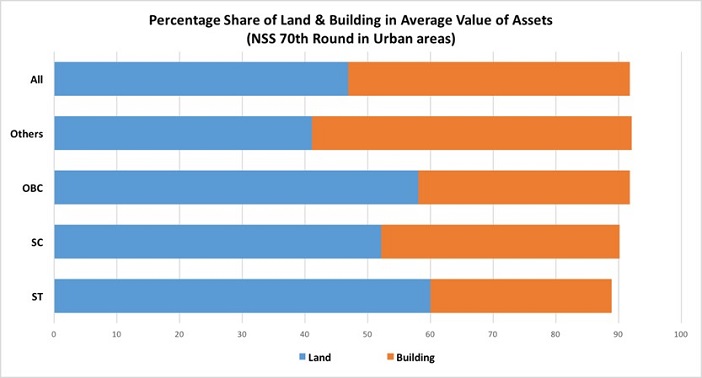
Share of Land highest across Social groups
Except for ‘Others’ in urban areas, ‘Land’ accounted for the highest share in assets for all the social groups both in urban and rural areas. ‘Building’ was the next. ‘Land’’ and ‘building’ accounted for nearly 90% of all assets for all social groups in both rural & urban areas. The share of ‘Land’ in assets was the lowest for SC households in rural areas. The share of land for SC households in rural areas is almost 15% less than the share of land for ‘Other’ households. The share of building in rural areas for both SC & ST households was higher than ‘Others’. The share of building was lower than the share of land for only ‘Others’ in urban areas with building accounting for 51% of the asset value. The share of other assets was nominal for all the social groups.
 Only 3% of SC & ST households in the richest 10% in rural areas
As per the report, as many as 91% of SC or ST households were in the category of ‘8th decile or less’ in terms of AVA. In other words, only 9% of the SC or ST households are in the richest 20% in terms of AVA. This is very less when compared to 23% for OBCs and 30% for ‘Others’. The situation is more or less similar in urban areas.
The difference is starker in the richest 10%. Only 3.5% ST and 3% SC households belonged to the richest 10% class whereas the 18% households of ‘Others’ were in the richest 10% in rural areas. In urban areas, only 2.4% of the SC households and 5.3% ST households belonged to the richest 10%.
More than 30% of all the households are indebted
31.4% of all the rural households reported they were in debt and the average amount of debt being Rs 103000. Only 16.9% of the ST households reported they were in debt while the number of indebted households was more than 30% for all the other social groups. The average of amount of debt in urban areas was Rs 378000 and 22.4% of the urban households were indebted.
Featured Image: Assets owned by SC & ST Households


1 Comment
Govt should increase their reservation percentage…Give them more freebies, impose more taxes on middle class, then only this menace can go…