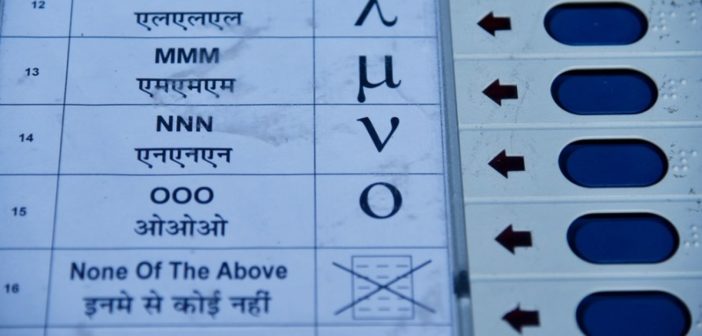
TL; DR: NOTA polled 9.1 lakh votes (1.81%) in Bihar’s 2025 assembly election despite record turnout, yet remains below 2015 levels. In 27 constituencies, NOTA exceeded victory margins, repeating patterns from 2020 and 2015. Five seats showed this twice, reflecting localised protest voting driven by limited choices and perceived unresponsiveness.
Context
The “None of the Above” (NOTA) option was introduced in Indian elections in 2013 to allow voters to formally reject all candidates while still participating in the electoral process. It had created a new space for citizens to signal dissatisfaction with available political choices. Bihar has frequently shown higher than average NOTA usage, with an average 2% votes in the last two assembly elections, compared to a lesser share for other states in their previous two successive terms.
Understanding trends of NOTA behaviour can enrich our understanding of voter participation, protest, and political representation.
Who compiles this data?
Data on NOTA votes in India is compiled and published by the Election Commission of India (ECI), the constitutional body responsible for administering elections. The ECI collects vote counts from each polling station through the standard counting process, where NOTA appears as a separate category on Electronic Voting Machines (EVMs). After counting, the ECI releases constituency-level and booth-level results, including NOTA totals, through its official result platforms and statistical reports.
Where can I download clean & structured data about NOTA?
Clean, structured, and ready-to-use datasets on NOTA votes across both Assembly and Lok Sabha elections, organised by state and constituency, can be downloaded from Dataful.
Key Insights
NOTA share rises modestly in 2025 Bihar Assembly elections, yet remains below 2015 levels
According to the data from the Election Commission of India, the 2025 Bihar Assembly Elections recorded 9.1 lakh NOTA votes, accounting for 1.81% of all votes cast. This occurred in an election with Bihar’s highest-ever voter turnout of 66.91%, or more than 5 crore votes. In comparison, the 2020 elections saw about 7 lakh NOTA votes out of 4.2 crore total votes, while the 2015 elections registered 9.5 lakh NOTA votes from 3.8 crore ballots.
Although the 2025 share represents a slight rise from the 1.7% recorded in 2020, it remains notably below the 2.5% observed in 2015, the first year NOTA appeared in Bihar. One possible explanation could be a declining reliance on NOTA, as voters may increasingly view it as symbolically expressive but electorally inconsequential.
About 11% of seats saw NOTA totals higher than the margin of victory
In the 2025 Bihar Assembly elections, NOTA votes surpassed the margin of victory in 27 constituencies, reflecting meaningful levels of voter disengagement with available candidates. Similar patterns were observed in earlier cycles, with 30 constituencies in 2020 and 21 constituencies in 2015 showing NOTA totals higher than the winning margin.
Notably, five constituencies, namely Ramgarh, Chanpatia, Dehri, Jhajha, and Mahishi, recorded this phenomenon in two of the last three assembly elections post the introduction of NOTA, suggesting a recurring and localised pattern of voter discontent.
Within this group, Chanpatia and Dehri show shifting electoral competition, with different major candidates winning or losing by margins smaller than the NOTA vote count. Jhajha presents a contrasting pattern: the same candidate won across elections, yet each time with a margin lower than the number of NOTA votes. Mahishi and Ramgarh (2024 by poll and 2025) offers a third variation, where the winner and runner-up switched positions in successive elections, but in both cases the victory margin remained below the NOTA total.
Why does it matter?
High NOTA levels can indicate gaps in candidate selection, weak party linkages, or local grievances. These trends help in assessing whether political parties are providing meaningful choices and whether voters feel represented. Repeated or concentrated high NOTA levels may signal long-term political alienation or unmet expectations, thereby questioning the quality of democratic choice.
Key Numbers
- Share of NOTA Votes polled in Bihar Assembly Elections
2015– 2.5%; 2020– 1.7%; 2025– 1.8%
- Number of seats where NOTA votes polled is greater than the victory margin
2015– 21; 2020– 30; 2025– 27


