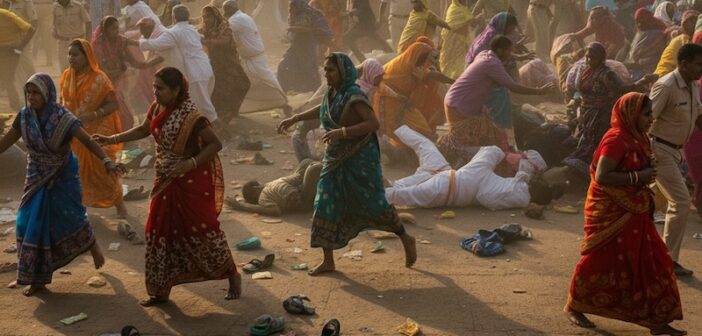
TL;DR The recent Karur stampede in Tamil Nadu, which claimed 41 lives at actor-politician Vijay’s rally in September 2025, is a tragic reminder of India’s vulnerability to crowd-related disasters. While stampedes are not new, data from the National Crime Records Bureau (NCRB) reveal a troubling picture: from 2017 to 2023 alone, 121 stampede cases resulted in 160 deaths. Between 2001 and 2023, states like Jharkhand, Maharashtra, and Andhra Pradesh consistently recorded the highest casualties, with some years witnessing hundreds of deaths from a single catastrophic incident.
Context
The chaos in Karur, Tamil Nadu, on 27 September 2025, unfolded as thousands of fans surged toward Vijay’s convoy during a political rally. Narrow spaces, uncontrolled crowding, and hours of waiting escalated into panic. Within minutes, at least 41 people, including nine children, were crushed to death, while dozens sustained injuries.
Stampedes have recurred in religious places, pilgrimages, festivals, and political rallies, highlighting systemic failures in crowd management and the urgent need for robust safety protocols.
Who Compiles This Data?
The NCRB, under India’s Ministry of Home Affairs, collects stampede data annually through state and UT police, and the same is published in the Accidental Deaths and Suicides in India (ADSI) reports. While the data is comprehensive, multiple incidents and non-fatal injuries may go unreported, making the dataset an incomplete reflection of the true scale.
Where can I download Clean & Structured Data about the Stampede Cases?
Clean, structured, and ready-to-use datasets related to Year, State and Gender wise Deaths and Injuries due to Stampede Incidents can be downloaded from Dataful.
Key Insights
Annual Trend of Stampede Incidents (2017–2023)
Between 2017 and 2023, India recorded 121 stampede cases, resulting in 160 deaths and at least 29 injuries.
- The deadliest year in this period was 2017 (49 deaths in 26 incidents), while 2018 saw the lowest toll (6 deaths across 5 incidents).
- The most recent year, 2023, recorded 32 deaths in 29 cases, showing that incidents remain frequent and deadly despite past tragedies.
A striking anomaly appears in 2017, 2020, and 2023, where high fatalities were recorded but injuries were zero or near-zero. For example, 49 people died in 2017, yet no injuries were reported. Such patterns strongly suggest underreporting or misclassification of non-fatal cases, as it is improbable for stampedes to cause deaths without leaving survivors injured.
Understanding How Deadly Each Incident Is
Looking beyond raw numbers, fatality and injury ratios reveal how deadly each incident is on average.
- Fatality Ratio = Deaths ÷ Number of cases
(Shows average deaths per incident) - Injury Ratio = Injuries ÷ Number of cases
(Shows average injuries per incident)
Between 2017 and 2023, the data shows striking patterns:
- Several years (2017, 2020, 2021, 2023) show fatality ratios around or above 1, but almost no injuries were recorded, indicating incomplete documentation of non-fatal cases.
- On 1 January 2022, a major stampede at the Mata Vaishno Devi shrine in Jammu and Kashmir resulted in 12 deaths and 16 injuries. That year recorded a fatality ratio of 3.67 and an injury ratio of 2.67, reflecting the severity and chaotic impact of large-scale crowd gatherings.
Who Bears the Brunt? Gender Breakdown of Victims (2014–2023)
Between 2014 and 2023, across 733 reported cases, men bore the highest toll with 619 deaths and 109 injuries, followed by women with 239 deaths and 50 injuries. Transgender individuals, included in official reporting only from 2014, recorded 5 deaths but 52 injuries, showing a high injury-to-death ratio.
These patterns highlight that stampedes affect groups differently, with men facing the most fatalities and transgender individuals showing increased vulnerability, underscoring the need for targeted safety measures.
Deadliest Years and States: When & Where Stampedes Struck Hardest
Long-term data shows catastrophic spikes in certain years, driven by a single large-scale tragedy:
- 2015: 480 deaths (Jharkhand, Baba Baidyanath Dham Temple stampede & others)
- 2013: 122 deaths (Madhya Pradesh, Ratangarh Temple stampede & others)
- 2011: 102 deaths (Kerala, Sabarimala stampede)
- 2008: 216 deaths (Rajasthan, Chamunda Devi Temple stampede)
- 2005: 346 deaths (Maharashtra, Mandher Devi Temple stampede & others)
Why Does It Matter?
Stampedes are preventable disasters. The persistence of such incidents in India despite detailed guidelines by the National Disaster Management Authority (NDMA) points to failures in:
- Crowd control infrastructure (narrow exits, bottlenecks).
- Real-time monitoring and communication systems.
- Accountability of organisers at large political and religious gatherings.
The data not only helps identify high-risk states and years but also pushes policymakers towards evidence-based crowd management strategies. Lessons from past tragedies have yet to translate into robust prevention.
Key Numbers (2017-2023, absolute and ratio values)
- Incidents: 121
- Deaths: 160
- Injuries: 29+
- Fatality Ratio: ~1.32
- Injury Ratio: ~0.24
- Gender Breakdown (2014–2023):
- Male: 619 deaths, 109 injuries
- Female: 239 deaths, 50 injuries
- Transgender: 5 deaths, 52 injuries


