Data: Total Outstanding Liabilities of State Governments Over ₹ 84 Lakh Crores or 29% of GSDP As of 2024
According to RBI data, the combined outstanding liabilities of all States stood at approximately ₹13 lakh crore as of 31 March 2007. This figure rose to ₹20 lakh crore by 2012, ₹39 lakh crore in 2017, and further increased to ₹84 lakh crore by 2024. On average, these liabilities have grown at an annual rate of 12%. The sharpest year-on-year increase occurred in 2016, at 19%, while the lowest growth was recorded in 2008.
State finances play a pivotal role in shaping India’s fiscal landscape, especially for the goal of becoming a “Viksit Bharat” by 2047. As key agents of public service delivery, State governments manage critical sectors. Their financial health significantly impacts the quality and reach of services such as health, education, infrastructure, and several others.
Revenue from States’ own taxes, State Goods and Services Tax (SGST), and non-tax revenues such as mining royalties, form a substantial part of their fiscal base in addition to devolution and other central transfers. The financial management and autonomy of these and other sectors enable States to make sustainable allocations for each need.
Conversely, fiscal mismanagement can lead to debt stress, reduced capital outlays, and delayed welfare delivery. Thus, strengthening State-level fiscal institutions, enhancing transparency, and ensuring sustainable debt practices are essential for India’s broader economic resilience.
With these crucial and other objectives, the Reserve Bank of India (RBI) publishes an annual report titled “State Finances – A Study of Budgets”, which provides an overview of the fiscal health of Indian States. The report delves into trends in revenue receipts, debt levels, expenditure quality, and other key indicators. In this article, we explore the major highlights from the latest 2024-25 edition of the report.
The data for this story is sourced from Dataful’s collection of datasets on State and Central government liabilities, together with the data presented in the RBI’s reports.
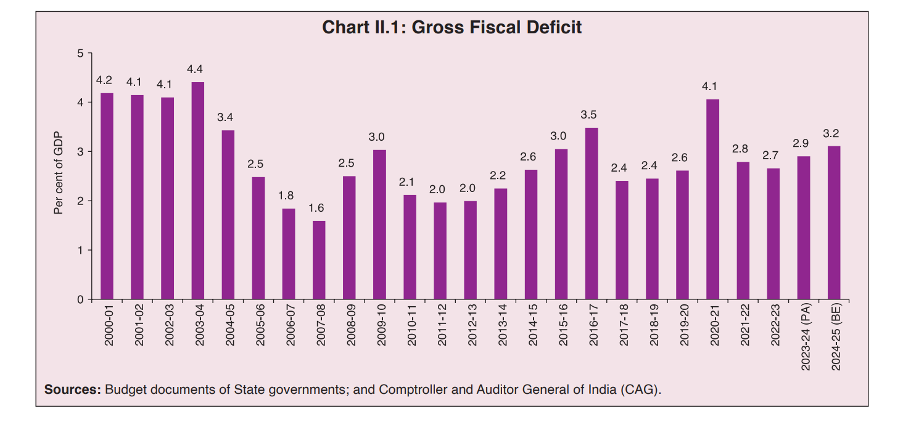
Between 2000-01 & 2022-23, Gross Fiscal Deficit Averaged 3% of GDP
The Gross Fiscal Deficit (GFD) is officially defined as the difference between aggregate disbursements and revenue receipts and non-debt capital receipts. As per the report, the GFD of all States combined (excluding Union Territories), in the year 2000-01, was 4.2% of the total states’ Gross Domestic Product (GDP). While it hovered around 4% up to 2003-04, it started to decline from 2004-05, with its peak decline to 1.6% during 2007-08. However, it has increased from 2007-08, again hovering around 3% in 2019-20, peaking to 4.1% during the COVID-19 year of 2020-21. Subsequently, it declined to below 3% and was 2.7% of GDP in 2022-23.
Overall, during the period from 2000-01 to 2022-23, GFD to GDP hovered around 3% on average each year.

Except Primary Revenue Deficit, all types of Deficits see significant surge
When compared by total value of deficit, the GFD of states saw an average year-on-year (y-o-y) increase of 19% during the period 2006-07 to 2023-24. The year 2009-10 saw a 78% jump from the previous year’s surplus of 3%. Following this was the COVID-19-affected year of 2020-21 with 53%.
The Revenue Deficit (RD), defined as “the difference between revenue expenditure and revenue receipts”, saw an average of 96% y-o-y increase during the period. In 2006-07, the RD had a surplus amount of Rs. 24,857 crores, meaning that the state government’s revenue receipts were higher than its revenue expenditure. The pattern had continued up to 2012-13, except during 2010-11. However, from 2013-14 onwards, the pattern of revenue expenditure being higher than the revenue receipts continued. It had peaked at Rs. 3.7 lakh crores during the COVID-19 year and has shown decreasing trends in the subsequent years.
Similarly, the Primary Deficit (PD), defined as “gross fiscal deficit less interest payments”, had surplus figures during 2006-07 to 2008-09. But it has also increased during the subsequent years.
However, the Primary Revenue Deficit (PRD), defined as “revenue deficit less interest payments”, has shown consistent surplus figures across all years during 2006-07 & 2022-23.
Between 2007 & 2024, outstanding liabilities have grown at an average of 12% each year
The sustained levels of States’ Gross Fiscal Deficit (GFD) at around 3–4% of their Gross State Domestic Product (GSDP) reflect the persistent accumulation of outstanding liabilities by State governments. According to RBI data, the combined outstanding liabilities of all States stood at approximately ₹13 lakh crore as of 31 March 2007. This figure rose to ₹20 lakh crore by 2012, ₹39 lakh crore in 2017, and further increased to ₹84 lakh crore by 2024. On average, these liabilities have grown at an annual rate of 12%. The sharpest year-on-year increase occurred in 2016, at 19%, while the lowest growth was recorded in 2008.
When measured against the States’ combined GDP, their liabilities were 29% in 2007. Although this ratio declined to around 22% between 2013 and 2015, a reversal began in 2016. It peaked at 31% in the COVID-19-affected year of 2021 and has remained elevated at around 29% between 2022 and 2024.
The report also underscored a substantial rise in financial guarantees and market borrowings by State governments, both of which are components of total outstanding liabilities. State government guarantees rose significantly from ₹4.2 lakh crore (3.4% of GDP) in 2015 to ₹10.4 lakh crore (3.9% of GDP) in 2023. Similarly, market borrowings increased from ₹6.5 lakh crore in 2020–21 to ₹7.1 lakh crore in 2023–24. Thus, the report pointed out that these issues remain critical to the overall health of the states’ finances.
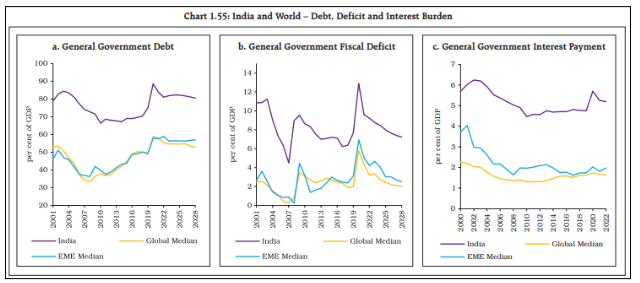
It is noteworthy that the RBI’s Financial Stability Report had already flagged India’s fiscal debt and deficit levels as significantly higher compared to the median values of global and Emerging Market Economies (EMEs). This is despite the enactment of the Fiscal Responsibility and Budget Management Act (FRBMA), which mandates limiting the central government’s debt to below 40% of GDP and the combined debt of the general government (Centre and States) to below 60% of GDP by 2024–25. Contrary to this mandate, the report notes that the general government debt stood at around 80% of GDP in 2025 and is projected to remain at that level even by 2028.

Some of the key initiatives undertaken by States to boost revenue
Despite the overall adverse trends, the report highlights progress by State governments in containing their Gross Fiscal Deficit (GFD) within the 3% of GDP limit for three consecutive years—from 2021–22 to 2023–24—though inter-State variations in GFD-to-GDP ratios persist. In another positive development, the ratio of revenue expenditure to capital outlay (RECO) has declined from 6.3% in 2021–22 to 5.2% in the 2024–25 Budget Estimates, indicating an improving quality of expenditure, although some States continue to report higher ratios.
Furthermore, the report acknowledges that several State governments are actively advancing fiscal consolidation and enhancing revenue collection through a range of policy and administrative measures. These are summarised below:
- Gujarat has established GST Seva Kendras to simplify registration and prevent documentation misuse.
- Haryana has plans to create facilitation cells to assist startups and MSMEs with GST compliance.
- Assam has implemented a similar system for its alcohol supply chain, alongside the introduction of e-tendering to ensure transparency in the issuance of wine licenses.
- Data analytics are being increasingly harnessed to track, monitor and simplify the refund process.
- Tamil Nadu and Karnataka are using AI-driven analytics for real-time monitoring
- Amnesty schemes have been introduced in States like Kerala and Rajasthan to waive penalties on tax arrears, aiding businesses in their transition to the GST regime.
- States like Karnataka and Odisha are using advanced technologies, including drone surveys and satellite imaging, to monitor mining operations, prevent illegal activities, and enhance mining revenue
Key recommendations made by RBI as way forward for fiscal consolidation of states
The report also made several key recommendations which would help in higher economic growth and macroeconomic stability. These are summarised below:
- States must rationalise and contain their subsidy expenditures to avoid displacing more productive spending. A source of emerging fiscal stress is the sharp increase in subsidies due to farm loan waivers, free or subsidised services (like electricity to agriculture and households, transport, gas cylinders), and direct cash transfers to farmers, youth, and women.
- An excess of Central government schemes limits State-level spending flexibility and weakens cooperative fiscal federalism. Rationalising Centrally Sponsored Schemes (CSS) can release fiscal space to meet State-specific needs and reduce financial pressure on both Union and State governments.
- Timely access to reliable, comprehensive fiscal data is essential for assessing State-level fiscal risks. However, inconsistencies in definitions, coverage, and methodologies across States—especially between States’ Fiscal Responsibility Legislations (FRLs), Finance Commissions, Union Ministry of Finance, and the Reserve Bank—lead to reporting ambiguities, inconsistent treatment of public accounts, and underreported liabilities.
- Uniform and consistent reporting of contingent liabilities and off-budget borrowings by States is vital. Greater fiscal transparency in these areas can improve discipline and reduce borrowing costs.
- Improving public expenditure efficiency through outcome budgeting—linking allocations to measurable results—is crucial for accountability and for prioritising high-impact economic and social sectors.
- Finally, climate budgeting should become a priority, integrating climate action into fiscal planning. States need to embed environmental goals into budgeting to promote sustainable development and long-term growth.