Women MPs in Lok Sabha: How have the numbers changed?
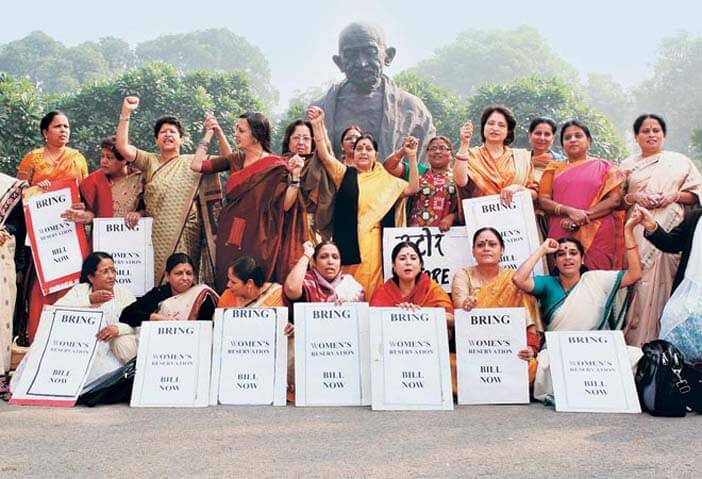
The issue of women’s representation in elected bodies came to the forefront yet again when a Women’s collective in Bengaluru launched a campaign to press for the passing of the Women’s Reservation bill in the parliament. Here is a look at the representation of Women in the Lok Sabha and how it has changed over the years.
The issue of women’s representation in elected bodies came to the forefront yet again when a Women’s collective in Bengaluru launched a campaign to press for the passing of the Women’s Reservation bill in the parliament. This, once again, brought forth the age-old debate of inadequacy of women in our elected bodies and whether there should be constitutional and legal safeguards for women in Parliament and state assemblies. The third- tier of elected bodies, the Panchayats, have already implemented 33% reservation for women. Apart from the fact that half the population is systemically excluded from political participation, representation and decision-making, what do the numbers tell us about women’s representation in Lok Sabha over the years?

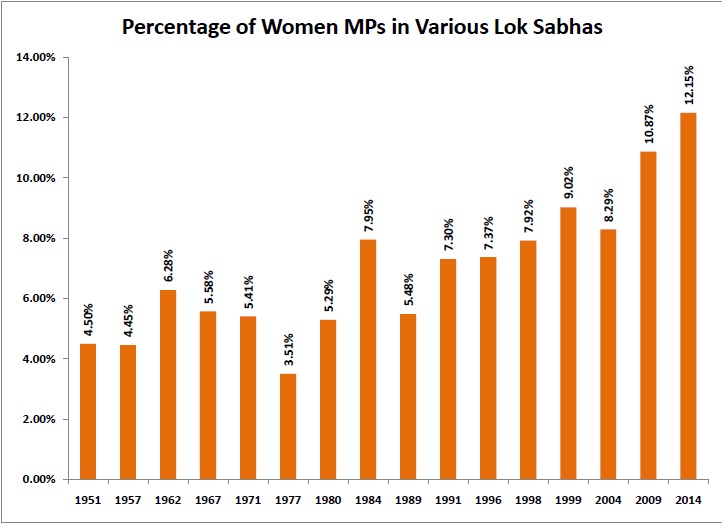
Increase in Women MPs since the first Lok Sabha
The first Lok Sabha in 1951 had 22 women MPs. The current Lok Sabha has 66. In the span of 54 years and 16 Lok Sabha elections it amounts to a three- fold increase in the number of women MPs that made their way to the lower house of the parliament. From 5% in 1951, women MPs constitute 12.2% of the Lok Sabha today. The rise in numbers has been steady through the years, both in absolute numbers and percentages. The notable exceptions have been the dip in numbers during the 6th Lok Sabha in 1977, the 9th Lok Sabha in 1989 and most recently the 14th Lok Sabha in 2004. The trends show a marked and steady increase from 1991 onwards to the present Lok Sabha. The 1991 figures show a jump from 5% in the previous Lok Sabha to 7% and the steady increase from thereon (except for 2004). It would be interesting to understand the factors for this watershed year and continuous rise and also the fall in numbers during 2004.
| S No | Year | Number of women MPs | Percentage of Women MPs |
|---|---|---|---|
| 1 | 1951 | 22 | 4.50% |
| 2 | 1957 | 22 | 4.45% |
| 3 | 1962 | 31 | 6.28% |
| 4 | 1967 | 29 | 5.58% |
| 5 | 1971 | 28 | 5.41% |
| 6 | 1977 | 19 | 3.51% |
| 7 | 1980 | 28 | 5.29% |
| 8 | 1984 | 43 | 7.95% |
| 9 | 1989 | 29 | 5.48% |
| 10 | 1991 | 39 | 7.30% |
| 11 | 1996 | 40 | 7.37% |
| 12 | 1998 | 43 | 7.92% |
| 13 | 1999 | 49 | 9.02% |
| 14 | 2004 | 45 | 8.29% |
| 15 | 2009 | 59 | 10.87% |
| 16 | 2014 | 66 | 12.15% |
The average representation of women MPs( 12.15%) is higher than the national average of women MLAs in state assemblies, which stands at a dismal 9%. While the numbers have increased over the years, the percentage of women that make up the Lok Sabha even today is not a figure to be proud of, especially when the ideal number should be at 33% at least. We still have a long way to go.
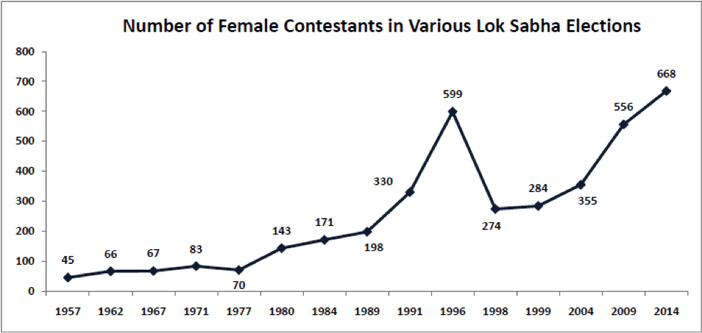
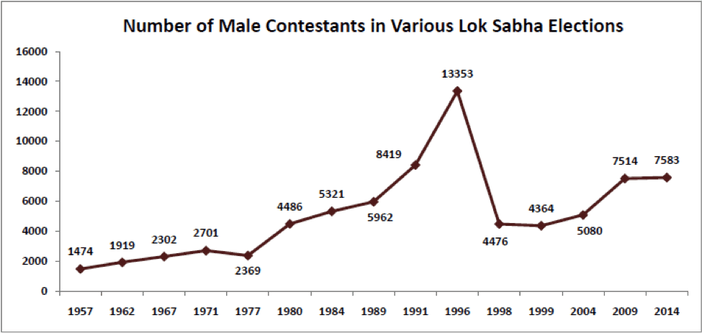
Central to the question of women’s representation in Lok Sabha is the appetite for women to take the political plunge and jump into the fray along with and against male candidates, getting tickets from their respective parties to contest elections and finally winning the seats that they contest. While popular perception might be that few women are willing to or have taken the political plunge, number of women contestants tells an interesting story. Between 1957(the earliest data available) and 2015, the total number of women contestants has increased from 45 to 668. That is a whopping 15 fold increase in the number of women contesting. If we looked at the data for male contestants for the same years, the number has increased from 1474 to 7583, a five- fold increase. The 15 fold increase in women contestants indicates towards the growing appetite for women to enter the political fray and willingness to be part of political decision-making.
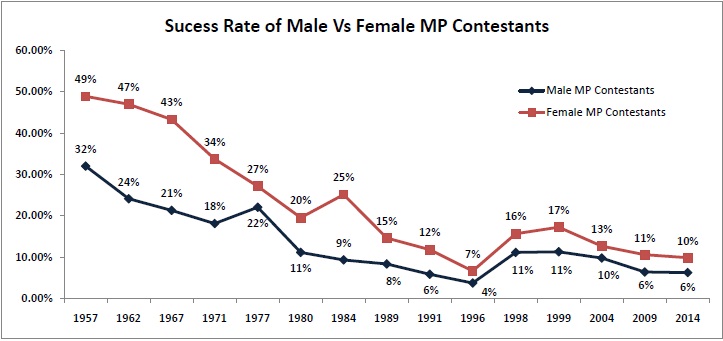
The other interesting story from the numbers over the years emerges from the relative success rate of women contestants as opposed to the male contestants. Consistently the success rate of women has been higher over the years than men. Success rate is the number of winners against the total contestants in that category. Women have had a greater success rate than Men in every single election. In some years, the difference has been quite stark. In 1971, the success rate for men was 18%, whereas it was 34% for women, which is twice that of men. For the current Lok Sabha, the success rate was 6.4% for men and 9.3% for women. This could mean one of the two things: Either women had a greater chance of winning from the seats that they stood from or that tickets were being given to women who had a greater chance of success. While numbers point towards a broad but important trend, it is fair not to be carried away by absolute conclusions, but to slice the data further and look at more granular data to establish causal relationships. While looking at women contestants currently, it would be fruitful to look at constituency level granularity of data to understand the profiles of women being given tickets within the context of entrenched patriarchal systems. What is the percentage of women who win come from political families and already nurtured constituencies as opposed to self-made women politicians?
Source: Data compiled by Factly team from the statistical reports of the Election Commission of India.