The Special Economic Zones in India – Fact Sheet
The Parliament is debating the amendment ordinance to the ‘The Right to Fair Compensation and Transparency in Land Acquisition, Rehabilitation and Resettlement Act’ (RFCTLARR). Land Acquisition has become a national subject for debate. It is important to understand if the land acquired for industrial purpose is actually put to use and to look at the related data. In this context, we bring you a series of stories discussing the issues & performance of Special Economic Zones in India based on the report of the Comptroller & Auditor General (CAG). Here is the first in that series, explaining the SEZ concept and other related facts.
[orc]Special Economic Zone (SEZ) is a special geographical region which has completely different laws when compared to other regions. SEZ’s enjoys tax breaks, simplified procedures, less regulations and restrictions, exemption from customs and duties, all of which is done to
- Generate additional Economic activity
- Promote exports of goods and services
- Promote Investment from domestic and foreign sources
- Create employment opportunities
- Develop Infrastructure facilities
Who can set up a SEZ?
- Private
- Public
- Private/Public
- State Government
- State Government Agencies
Who monitors SEZs?
An appointed committee of State govt. representative or a Development Commissioner is responsible to monitor the performance of SEZ on annual basis.
The Life Cycle of a SEZ
- Anybody who wishes to develop a SEZ submits a proposal to the Board of Approval (BoA). A Single Window approval mechanism has been provided through a 19 member inter ministerial Board of Approval (BoA), headed by the Secretary, Department of Commerce.
- The BoA then grants an ‘in-principle’ or a ‘formal’ approval.
- The Central Government issues a notification when the developer proves the possession, contiguity and irrevocable rights on Land. These are called ‘Notified SEZs’
- BoA allows the Developer for authorised operation. The SEZs that start operations are called ‘Operational SEZs’
- Developer/Units are allowed various Tax Concessions/exemptions for effecting Exports
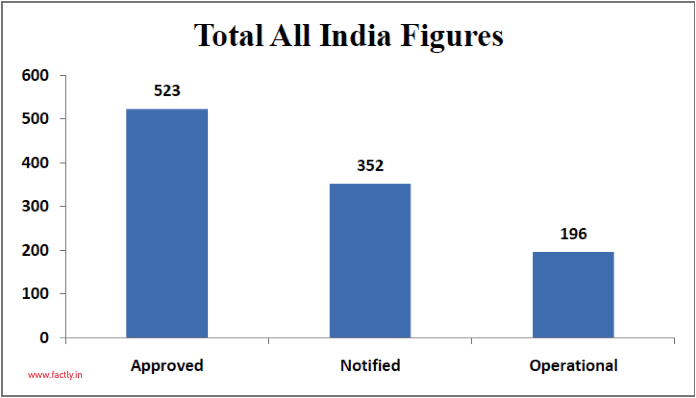
State-wise distribution of approved SEZs (As on 21st January, 2015)
Here is the state wise distribution of SEZs.
| State/Country | Total Approved (Formal + In principle) | Total Notified | Total Operational |
|---|---|---|---|
| All India | 523 | 352 | 196 |
| Maharashtra | 78 | 52 | 25 |
| Telangana | 60 | 42 | 24 |
| Karnataka | 59 | 39 | 25 |
| Tamil Nadu | 59 | 51 | 36 |
| Andhra Pradesh | 44 | 30 | 18 |
| Gujarat | 39 | 28 | 18 |
| Haryana | 37 | 25 | 6 |
| Kerala | 32 | 25 | 14 |
| Uttar Pradesh | 32 | 22 | 10 |
| Madhya Pradesh | 20 | 9 | 2 |
| West Bengal | 14 | 5 | 7 |
| Rajasthan | 10 | 8 | 4 |
| Odisha | 9 | 4 | 2 |
| Punjab | 8 | 2 | 2 |
| Goa | 7 | 3 | 0 |
| Chhattisgarh | 3 | 1 | 1 |
| Delhi | 3 | 0 | 0 |
| Chandigarh | 2 | 2 | 2 |
| Nagaland | 2 | 2 | 0 |
| Puducherry | 2 | 0 | 0 |
| Jharkhand | 1 | 1 | 0 |
| Manipur | 1 | 1 | 0 |
| Uttarakhand | 1 | 0 | 0 |
The Top 10 states in terms of SEZ approvals are

Here is the complete list of SEZs that are formally approved & those that are notified.
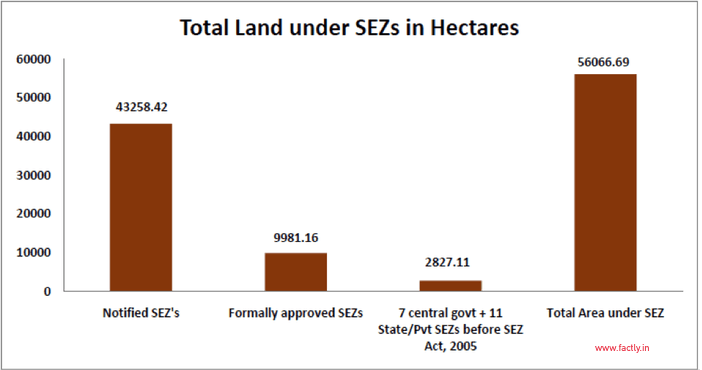
Total land for these SEZs
1 Hectare = 2.47 acres
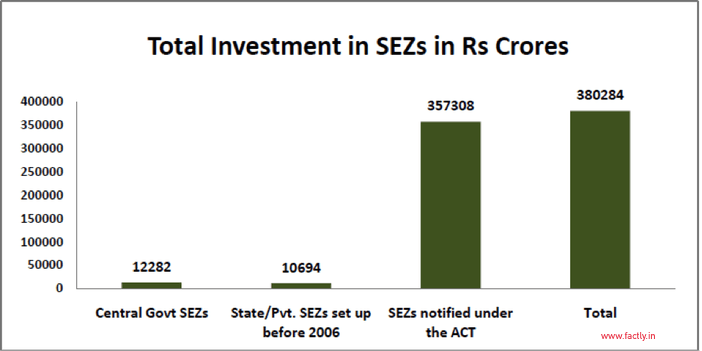
Total investment in SEZs in Rs Crores (As on 30th September, 2014)
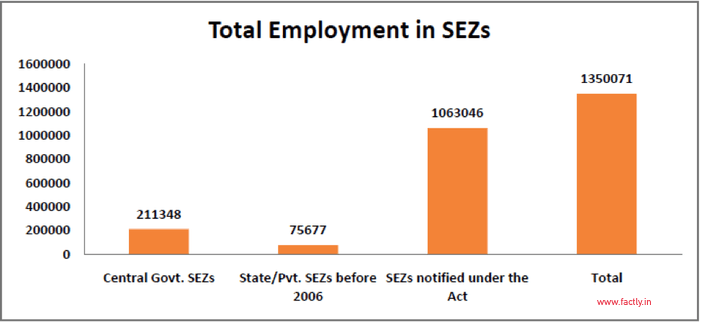
Total employment in SEZs in terms of number of people (As on 30th September, 2014)
Data Source: www.sezindia.nic.in