[orc]The high voltage Bihar assembly elections of 2015 finally came to an end with the Grand Alliance registering an emphatic win. They won by more than 2/3rd majority in the house. Even the Congress party made impressive gains. The NDA tally could not cross the 60 mark as both the BJP and its alliance partners fared poorly. In a two part series, we look at some of the important statistical highlights of the 2015 Bihar assembly election results.
The results of the 2015 assembly elections in Bihar surprised many, largely because of the scale of the victory of the Grand Alliance (GA). Most opinion & exit polls predicted a neck to neck fight with some giving NDA the edge and others rooting for GA. But behind this massive victory of the GA, there are some interesting numbers. Here is a two part series exploring some of the highlights from these elections.
Vote Share
In terms of the vote share, the BJP got the highest share of 24.4%, while it must be mentioned that BJP also contested in the highest number of seats. If one takes into account the vote share per seat contested, the RJD leads the pack followed by JD(U) and the Congress; BJP came a distant fourth. One of the reasons for the NDA’s loss is BJP’s loss of more than 5% vote share compared to the 2014 Lok Sabha election. As a group, the NDA lost more than 5% of the vote share compared to the 2014 Lok Sabha election. On the other hand, the GA had lost more than 3% of their collective vote share compared to 2014 Lok Sabha election. While 3% loss is substantial, it must be noted that the GA contested separately in 2014 and to their credit, they were able to hold onto their vote share despite contesting a lesser number of seats. JD(U)’s turnaround is quite remarkable so much so that they improved their vote share compared to 2014 despite contesting in less than half the number of seats.
| Alliance | Party | 2010 | 2014 Lok Sabha | 2015 | |||
|---|---|---|---|---|---|---|---|
| Number of Seats Contested | Vote Share % | Number of Assembly Segments Contested | Vote Share % | Number of Seats Contested | Vote Share % | ||
| NDA | BJP | 102 | 16.5 | 176 | 29.9 | 157 | 24.4 |
| LJP | 75 | 6.7 | 43 | 6.5 | 42 | 4.8 | |
| RLSP | NA | NA | 24 | 3.1 | 23 | 2.6 | |
| HAM | NA | NA | NA | NA | 21 | 2.3 | |
| GA | JD(U) | 141 | 22.6 | 230 | 16.0 | 101 | 16.8 |
| RJD | 168 | 18.8 | 165 | 20.5 | 101 | 18.4 | |
| INC | 243 | 8.4 | 78 | 8.6 | 41 | 6.7 | |
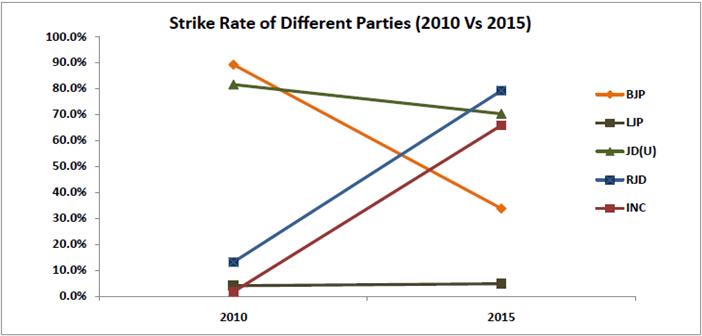
Strike Rate
Strike Rate of a party is defined as the number of seats won to the number of seats contested. In the 2010 Bihar Assembly Election, the BJP had the best strike rate of close to 90%, winning every 9 out of 10 seats it contested. The BJP even had a better strike rate than the JD(U) in 2010. The RJD and the Congress had dismal strike rates of 13.1% and 1.6% respectively. In 2015, the situation was quite a contrast. The RJD had the best strike rate of close to 80% of all the parties, followed by JD(U) with 70%. Even Congress had a strike rate of 66%, up from a mere 1.6% in 2010. On the other hand, BJP’s strike rate went down to 34%. The NDA allies (LJP, RLSP & HAM) had a single digit strike rate. The GA’s strike rate was 3 times that of the NDA.
| Alliance | Party | 2010 | 2015 | ||
|---|---|---|---|---|---|
| Number of Seats Won | Strike Rate (%) | Number of Seats Won | Strike Rate (%) | ||
| NDA | BJP | 91 | 89.2% | 53 | 33.8% |
| LJP | 3 | 4.0% | 2 | 4.8% | |
| RLSP | NA | NA | 2 | 8.7% | |
| HAM | NA | NA | 1 | 4.8% | |
| GA | JD(U) | 115 | 81.6% | 71 | 70.3% |
| RJD | 22 | 13.1% | 80 | 79.2% | |
| INC | 4 | 1.6% | 27 | 65.9% | |
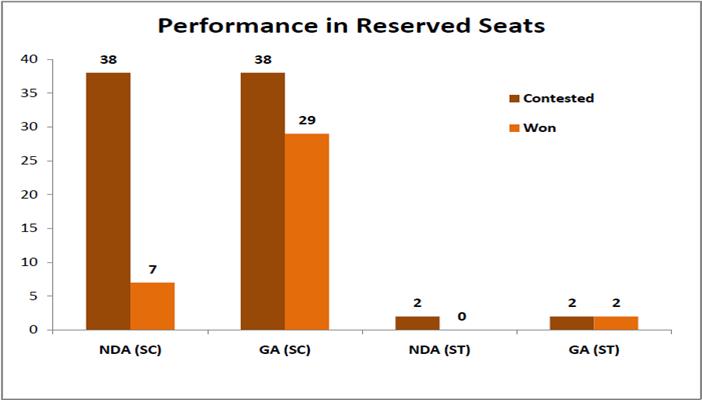
Performance in Reserved & General Seats
It was expected that the NDA would do well in the reserved seats with the likes of both LJP & HAM in its fold. Bihar has a total of 38 seats reserved for SCs and 2 for the STs. The NDA’s performance in the reserved seats was actually worse than its performance in the general seats. Out of the 38 it contested, the NDA could win only 7 SC reserved seats. The Grand Alliance, on the other hand won in 29 of the 38 seats reserved seats for SCs. Both the ST reserved seats were won by the Grand Alliance. The LJP contested in 9 SC reserved seats and could not win in a single seat.
| Party/Alliance | Number of SC Seats Contested | Number of ST Seats Contested | Number of SC Seats Won | Number of ST Seats Won |
|---|---|---|---|---|
| BJP | 21 | 1 | 5 | 0 |
| LJP | 9 | 1 | 0 | 0 |
| RLSP | 2 | 0 | 1 | 0 |
| HAM | 6 | 0 | 1 | 0 |
| NDA | 38 | 2 | 7 | 0 |
| JD(U) | 13 | 0 | 11 | 0 |
| RJD | 16 | 1 | 13 | 1 |
| INC | 9 | 1 | 5 | 1 |
| GA | 38 | 2 | 29 | 2 |
In fact, the NDA’s vote share in reserved seats was less than its vote share in general seats. For the GA, its share in SC reserved seats was 2% more than its vote share in general seats.
| Vote Share in % | |||
|---|---|---|---|
| Alliance | SC Reserved Seats | ST Reserved Seats | General Seats |
| NDA | 33.9% | 31.7% | 34.1% |
| GA | 44.9% | 39.9% | 41.3% |
| Others | 21.1% | 28.4% | 24.6% |


5 Comments
Hi Rakesh, Always amazed with the way you analyze the things.. I have a question here about the vote percentage..
It is known that BJP got the highest vote percentage, but u have also mentioned that they also contested in highest number of seats. So comparing the vote %es is not a good indicator for comparison. Hence you have taken the total votes per seats contested to compare. I think this is also a good indicator, because in an alliance, other party voters also might have voted. E.g. Congress might have got votes which are of JDU or RJD probably. Would want to hear ur comment on this.
Do you think if there is any better indicator to compare or this is the best indicator available?
It is true that the parties have contested in allince with others. But for any comparision, we need to normalise. Hence absolute vote share is not the right indicator since they contested in different number of seats. Since all the major parties, contested as an alliance, it is fair to compare votes per seat contested. If Congress got the votes of RJD & JD(U), BJP must have got votes of LJP, HAM & RLSP. They did not win as many votes is a different question. In the absence of any other indicator, this probably is the closest to the best indicator
Hi Pavan,
I have a concept to analyse the gain and loss in coalition politics. Assuming every political party has a vote bank in each constituency and the number of seats a party gets to contest within a coalition is a fair assessment of the value of their vote bank, we can analyse the gain or loss by calculating the vote share percentage per seat contested. For example, in 2010 when INC contested all 243 seats, they got 8.4% vote share which works out to 0.035% per seat contested. In the Grand Alliance they got 41 seats to contest which got them a vote share of 6.70% which works out to 0.163% per seat contested. INC is a big gainer in this context. RJD is gainer too with 0.112% in 2010 and 0.182% in 2015. JDU maintained more or less with 0.160% in 2010 and 0.166% in 2015. Howver, BJP in spite of a growth in the total vote share, is down from 0.162% in 2010 to 0.155% in 2015.
In Bihar and in many parts of India BJP would not be able to win until they get a fair share of muslim votes.In Delhi election muslims votes casted in fabour of AAP and congress I secretly supported this overnight move at its own cost just to keep away modi. In Bihar too congress accepted IIIrd place to keep modi away.In my openion congress got all the votes of alliance party there is no one who like congress. ln India statistical data do not conclude any thing.There is always some fringe event dictating the outcome like Award Wapsi.
Pingback: Women MPs in Lok Sabha: How have the numbers changed? – Gender and Politics