[orc]The strike of the employee unions of the Telangana State Road Transport Corporation has put the spotlight on the performance of SRTUs. Here is a 3-part series that looks at the various aspects of SRTUs. In the first part, we look at the physical performance of the SRTUs.
About 48,000 employees of Telangana State Road Transport Corporation began an indefinite strike on 05 October 2019 demanding a higher pay, merger with government, job security to employees among other things. Incidents of suicides and suicide attempts by those protesting have also been reported in the state. As the protest by TSRTC employee unions in Telangana intensifies, in a three-part series, we analyse the performance of the State Road Transport Undertakings (SRTUs) in India. The first part looks into the physical performance such as fleet size, vehicle productivity etc. over the years. In the second part, we look at the staff related statistics and accidents and the last part will look into the pecuniary aspects of SRTUs.
There were 54 SRTUs in India as per the SRTU performance report of 2015-16
The Ministry of Road Transport & Highways (MoRTH) publishes reports of SRTUs for every financial year. The last such report is available only for the financial year 2015-16. Every year, the number of SRTUs which submit their report to the ministry is different. What has been observed is that the number of SRTUs that have submitted the report has increased gradually from 34 in 2009-10 to 47 in 2015-16. The data from the latest 2015-16 report indicates that altogether there were a total of 54 SRTUs in 2015-16 of which only 47 had submitted their reports. These 47 SRTUs together had 1.42 lakh buses. Though the number of States/UTs in India is only 36, the number of SRTUs is more than 50 because some states have multiple SRTUs. Tamil Nadu has 7 SRTUs followed by Maharashtra which has 6 and Karnataka which has 4.
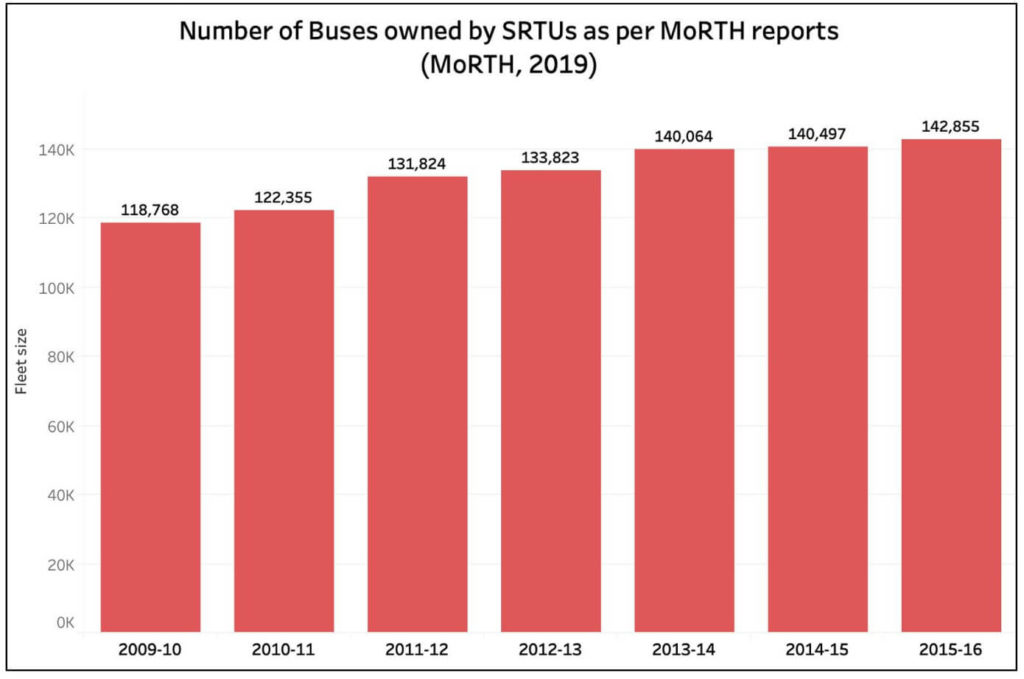
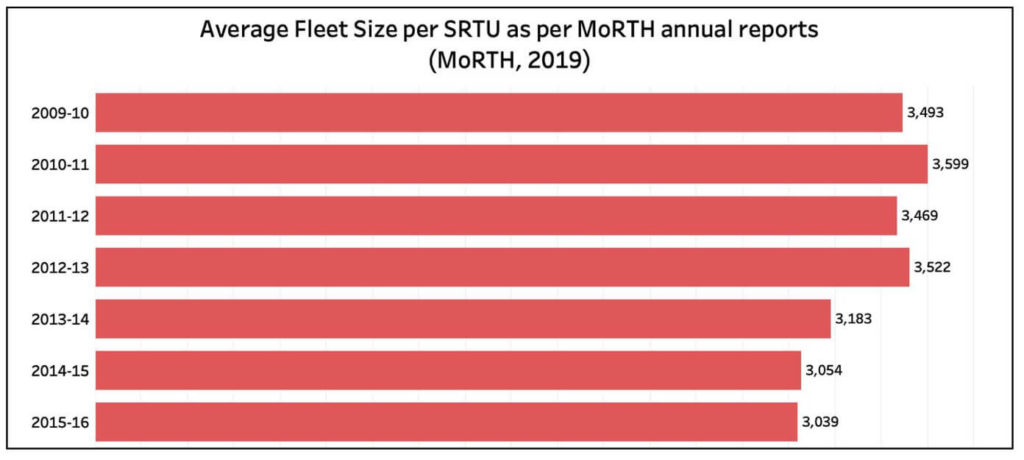
Even though the numbers suggest that the total number of buses has increased over the years, it should be kept in mind that the number of SRTUs that have submitted data has also increased during this period. In order to make the numbers comparable, the arithmetic average number of buses under each SRTU has been calculated and demonstrated in the following chart. From this, it is clear that the average fleet size per SRTU has actually decreased over the years.
Maharashtra SRTC has the largest number of buses followed by Andhra Pradesh SRTC and Telangana SRTC
The fleet size owned by various SRTU shows a decreasing trend since 2012-13. On an average, in 2015-16, each SRTU owns only 3039 buses compared to an average of 3,599 buses per SRTU in 2010-11. According to the 2015-16 report, Maharashtra SRTC had the largest fleet size with 18,514 buses, followed by Andhra Pradesh with 12,012 buses. Telangana SRTC had a fleet size of 10,391 buses- third highest in the country, which accounts for a 7.3% share of the total fleet size of the 47 SRTUs in 2015-16. Before the formation of Telangana state, United Andhra Pradesh SRTC had the largest fleet size followed by Maharashtra SRTC. However, in terms of states, Maharashtra had the highest fleet size if all the 6 SRTUs are taken into consideration. SRTUs in north eastern states- Sikkim NT, Arunachal Pradesh ST, Meghalaya STC, Mizoram ST and Tripura RTC have the lowest fleet size and had a combined share of just 0.3% of total fleet size reported in 2015-16. This could be because of the lower population in these states and the difficult terrain.
A little over 90% of the total number of buses owned by SRTUs are operational
Despite the SRTUs owning more than 1.4 lakh buses in 2015-16, only 1.29 lakh buses were operating. In other words, only 90.4% of the fleet size was operational & plying on the roads. Fleet utilisation is calculated as the percentage of operational buses over fleet size. Fleet utilisation had dropped from 92.4% in 2009-10 to 89.5% in 2013-14. In 2015-16, fleet utilisation was 90.4%, less than the same in preceding year, 90.9% in 2014-15. Telangana SRTC had a fleet utilisation of 99.88% in 2015-16. The average age of buses in Telangana as of 2015-16 was 7.12 years. A total of 17.21% of the buses of Telangana SRTC operational in 2015-16 were over aged vehicles.
Vehicle productivity of Telangana SRTC has been better than the national average despite witnessing a decline in 2015-16
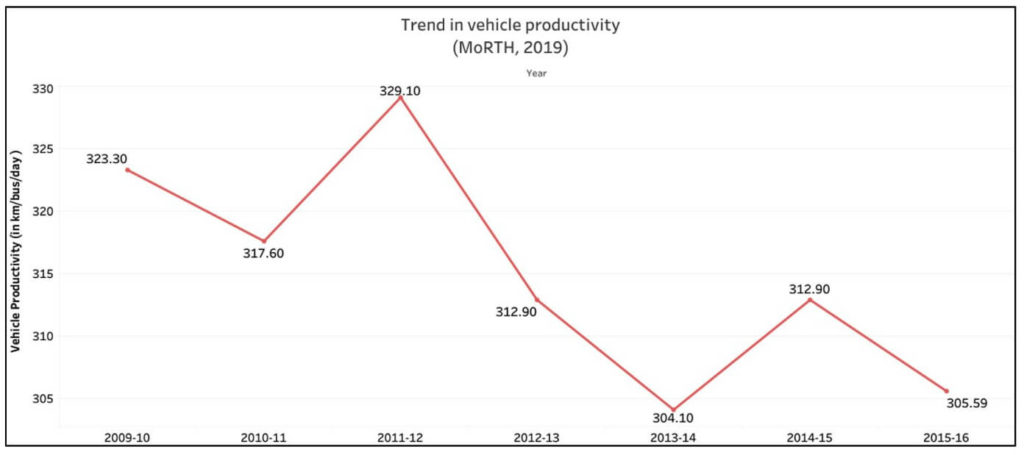
Fleet utilisation is a parameter which gives an idea of quality of the vehicles and their maintenance. The average number of revenue earning kilometres traversed by each bus per day is determined in order to ascertain the productivity of vehicle. Vehicle productivity across the country has reduced substantially over the years. From 323.3 km per bus per day in 2009-10, the productivity decreased to 305.59 km per bus per day in 2015-16. While Maharashtra SRTC had recorded the maximum revenue earning kilometres with over 21,066 lakh kilometres (because of the larger fleet size), Telangana SRTC recorded 12,381.39 lakh revenue earning kilometres in 2015-16. Vehicle productivity of Telangana SRTC stood at 325.56 kilometres per bus per day in 2015-16, better than the national average. However, this is less than the 330.22 km per bus per day recorded in Telangana SRTC in 2014-15.
Telangana SRTC reported the largest number of passengers carried in 2015-16
Along with the Indian Railways, SRTUs are the backbone of public transport in the country. A large chunk of the population depends on public transport since it is cost effective and convenient in addition to reducing carbon footprint.
The year 2011-12 witnessed the highest vehicle productivity with 329.1 km per bus per day across SRTUs in India, in the 7-year period between 2009-10 & 2015-16. The largest number of passengers in buses under SRTUs was also recorded in the same year.
During the 7-year period between 2009-10 and 2015-16, more than 2910 crore passengers travelled in the SRTUs in 2011-12, marking the highest number of passengers. In 2015-16, close to 2490 crore passengers have availed the services of SRTUs. In other words, an average of 6.82 crore passengers per day availed the services of SRTUs across the country in 2015-16. Telangana SRTC alone carried more than 329 crore passengers in 2015-16 (an average of 90 lakh a day), the largest number of passengers for a SRTU in that year.
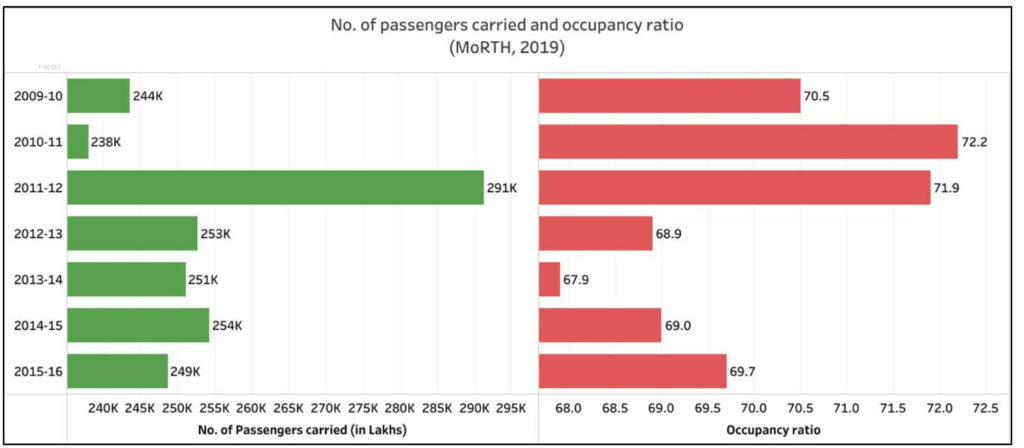
Occupancy ratio is measured as percentage of passenger kilometres performed to passenger kilometres offered. This can also be inferred as the percentage of seats occupied against the seats available. Occupancy ratio over the years has varied between 67.9% to 72.2%. In 2015-16, the occupancy ratio was 69.7%. Telangana SRTC’s occupancy ratio increased from 69% in 2014-15 to 70.21% in 2015-16.
In the subsequent stories, we will look at the staff strength of each SRTU, accidents amount other things.
Featured Image:State Road Transport Undertakings


1 Comment
Pingback: Part-1: Average Fleet Size & Vehicle Productivity of SRTUs decreases over the years - Fact Checking Tools | Factbase.us