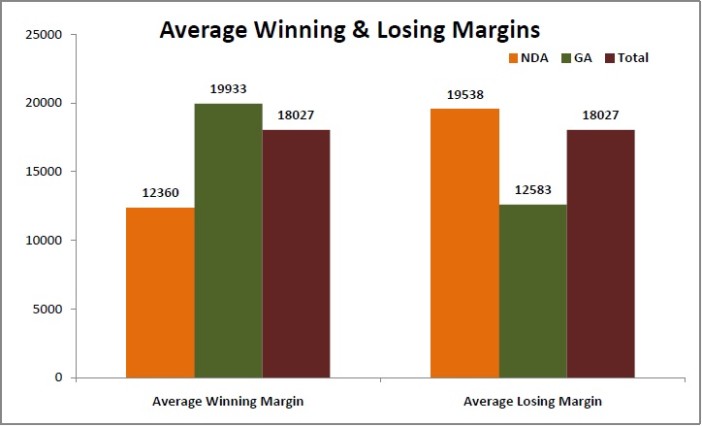
[orc]In part 2 of the series on statistical highlights of the Bihar 2015 elections, we look at victory margins & NOTA. The Victory Margin of the Grand Alliance was close to an average of 20000 per seat, almost 7500 more than the victory margin of the NDA. This is the first election after the NOTA symbol was introduced on the EVMs. To everyone’s surprise, NOTA polled 2.5% of the total vote and NOTA count was more than the victory margin in 21 of the constituencies.
In part 1, we looked at the vote share, strike rate & the performance of both the major alliances in reserved seats. In this piece, we look at the victory margin, impact of NOTA etc.
The Victory Margin
Though the election was billed as a close contest, the victory margins suggest otherwise. Only 8 seats were won with a margin of less than 1000 votes. Almost 87% of the seats were won with a margin of more than 5000 votes and 70% of the seats were won with a margin of more than 10000 votes. Close to 19% seats were won with a margin of more than 30000 votes and six seats were won with a margin of more than 50000 votes. In fact, all the six seats won with a margin of more than 50000 votes went to the Grand Alliance (GA). NDA won only three seats with a margin of more than 30000 votes while the Grand Alliance won 41 seats with a margin of more than 30000 votes.
| Margin of Victory | Number of Seats | Percentage of Seats |
|---|---|---|
| Less than 1000 votes | 8 | 3.3% |
| Between 1000 and 5000 Votes | 24 | 9.9% |
| Between 5000 and 10000 votes | 41 | 16.9% |
| Between 10000 and 20000 votes | 80 | 32.9% |
| Between 20000 and 30000 | 45 | 18.5% |
| More than 30000 votes | 45 | 18.5% |
| More than 50000 votes | 6 | 2.5% |
The Victory Margin of Alliances
The scale of the Grand Alliance’s victory was evident even in the victory margin. While the victory margin of the GA was an average of 19933 votes per seat, the victory margin of the NDA was only an average of 12360 per seat. The LJP and the HAM have high victory margins because they won in only 2 and 1 seat respectively. On the whole, the average victory margin of the GA more than the average victory margin of the NDA by about 7500 votes.
The NDA came second in 175 seats and its losing margin was close to the victory margin of the GA. The average losing margin of the NDA was 19538 compared to the average losing margin of 12583 for the GA. The GA came second in 59 seats. The GA’s victory margin was more than the average while its losing margin was less than the average.
| Party | Avg Victory Margin | 2nd Place in how many seats | Avg Losing Margin |
|---|---|---|---|
| BJP | 11804 | 102 | 16945 |
| LJP | 24107 | 36 | 23612 |
| HAM | 29408 | 18 | 24313 |
| RLSP | 6837 | 19 | 21220 |
| NDA | 12360 | 175 | 19538 |
| JD(U) | 21202 | 28 | 12730 |
| RJD | 19852 | 19 | 8525 |
| INC | 16836 | 12 | 18666 |
| GA | 19933 | 59 | 12583 |
| Total | 18027 | NA | 18027 |
BJP won half the seats with a margin of less than 10000 votes
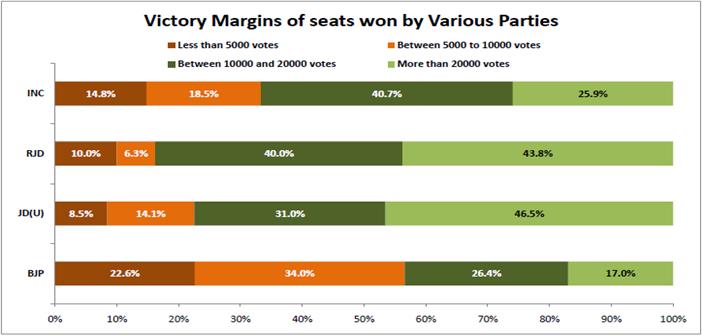
BJP won 30 of the 53 seats with less than a margin of the 10000 votes or less than 5% of the votes polled in most constituencies. Unlike the BJP, all the parties of the GA won more than 70% of the seats with a margin of more than 10000 votes. In fact, JD(U) won 47% of the seats with a margin of more than 20000 votes.
| Victory Margins of Different Parties | |||||
|---|---|---|---|---|---|
| Party | Less than 5000 votes | Between 5000 to 10000 votes | Between 10000 and 20000 votes | More than 20000 votes | Total Seats Won |
| BJP | 12 | 18 | 14 | 9 | 53 |
| JD(U) | 6 | 10 | 22 | 33 | 71 |
| RJD | 8 | 5 | 32 | 35 | 80 |
| INC | 4 | 5 | 11 | 7 | 27 |
Impact of NOTA
This is the first election after the Election Commission of India (ECI) has introduced the NOTA symbol. The EVMs had a NOTA symbol along with the symbols of all the contesting parties & independents. The NOTA symbol seems to have had an impact in this election with close to 9.5 lakh voters opting for NOTA, which is 2.5% of the total votes polled. This is more than the vote polled by the HAM. In the 2014 Lok Sabha election, only 1% of all the voters chose NOTA when there was no symbol.
The victory margin in 21 seats was less than NOTA count
What is even more interesting is that the number of votes polled for NOTA was more than the victory margin in 21 seats or close to 9% of all the seats.
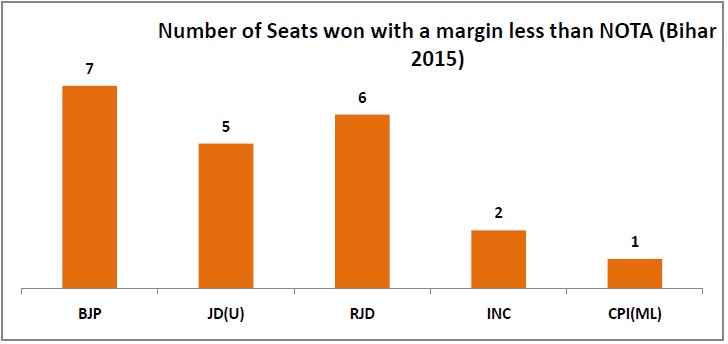
BJP won from 7 such seats while JD(U) won from 5 such seats. On the other hand, RJD won 6 such seats. The highest NOTA count was in Warisnagar constituency where NOTA polled 9551 votes (the margin of victory here was more than 50000 votes). NOTA polled an average of 4000 votes in all the constituencies and polled more than 5000 votes in 72 constituencies.
Here is the list of those 21 constituencies where the NOTA count was more than the margin of victory.
| S No | Name of the Constituency | Margin of Victory | NOTA Votes |
|---|---|---|---|
| 1 | Kuchaikote | 3562 | 7512 |
| 2 | Sheohar | 461 | 4383 |
| 3 | Tarari | 272 | 3858 |
| 4 | Nalanda | 2996 | 6531 |
| 5 | Chanpatia | 464 | 4506 |
| 6 | Biharsharif | 2340 | 5191 |
| 7 | Sikta | 2835 | 5579 |
| 8 | Arrah | 666 | 3203 |
| 9 | Chainpur | 671 | 3074 |
| 10 | Sherghati | 4834 | 6482 |
| 11 | Siwan | 3534 | 5119 |
| 12 | Baruraj | 4909 | 6208 |
| 13 | Amnour | 5251 | 6447 |
| 14 | Banmankhi (SC) | 708 | 1859 |
| 15 | Rajauli (SC) | 4615 | 5541 |
| 16 | Barauli | 504 | 988 |
| 17 | Kasba | 1794 | 2058 |
| 18 | Jhanjharpur | 834 | 1044 |
| 19 | Raxaul | 3169 | 3310 |
| 20 | Gobindpur | 4399 | 5411 |
| 21 | Dehri | 3898 | 4458 |


5 Comments
Hi Rakesh, I was looking into the NOTA data for a project and by my count there seems to be only 21 constituencies where NOTA exceeded winning margins. Moreover, our lists also vary. I am writing here to check whether there is a difference in the sources we used. My list includes Gobindpur and Dehri, which are missing from yours.
If my source is right or hasn’t been revised, then could you please check your NOTA count for Harlakhi, Gaighat and Dinara? The NOTA numbers mentioned for these constituencies seem to be those of Harnaut, Garkha and Dumraon respectively instead.
Also there are two constituencies with the name Pipra (AC no. 17 and 42), and therefore the numbers seemed to have been mixed up here. By my count, both these constituencies do not make the cut here.
Would love to hear from you to double-check my source 🙂 Thanks!
Thanks for bringing it to our notice. We had done this analysis just a day after the results and the numbers were taken from the results website. There seems to be some reconciliation and that’s why the issue with numbers. We have corrected the same.
Pingback: Q: In the 2016 Assembly polls, who’s afraid of Nota? A: All of the above - Firstpost
Pingback: Q: In the 2016 Assembly polls, who’s afraid of Nota? A: All of the above | EikAwaz.com
Pingback: Women MPs in Lok Sabha: How have the numbers changed? – Gender and Politics