Debarring Independent Candidates from Contesting Elections – Did the Law Commission get its recommendation right?
The Law Commission of India has now submitted its 255th Report on Electoral Reforms. The recommendations were made in a host of areas. Some of the important areas where the recommendations were made include
- Election Finance Reform
- Regulation of political parties and inner party democracy
- From first past the post to proportional representation
- Anti-defection law
- Strengthening the office of Election Commission of India
- Paid News & Political Advertising
- Opinion Polls
- Compulsory Voting
- Election Petitions
- NOTA & Right to Reject
- Right to Recall
- Independent Candidates
We will do a series of articles on some of these important areas and look at the recommendations of the Law Commission. In this article we will look at the issue of Independent candidates in elections since the Law Commission in its 255th Report has recommended debarring Independent candidates from contesting in Parliament & Assembly Elections.
Even the 170th Law Commission report in 1999 had recommended debarring the independent candidates from contesting in elections. The reasons for these recommendations are manifold. The NCRWC (The National Commission to Review the Working of the Constitution) recommended the “discouragement” of independent candidates, who are often “dummy” candidates or defectors from their party or those denied party tickets. It is also argued that independent candidates are non-serious candidates with very little chance of winning. In the recent times it is also observed that there exists a practice of independent candidates standing with the same name as candidates from recognized political parties, and this can cause a real confusion in the minds of the public, which might only look at the name of the candidate instead of the party symbol. But what do the numbers say about these reasons?
Number of Independents over the years
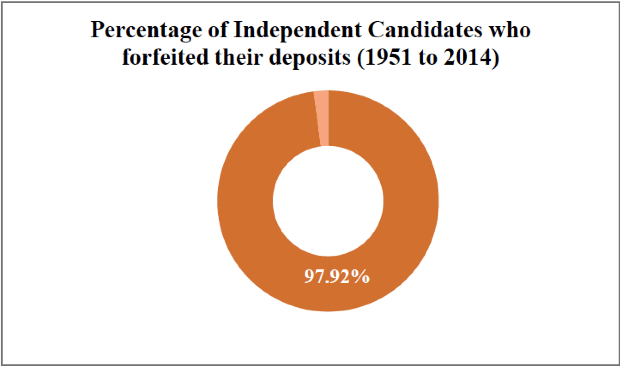
The number of independents contesting elections has steadily increased starting from the first general election in 1951. In 2014, a total of 3234 independents contested the election. An overwhelming number of these independents forfeit their deposits every election. In 2014, 99.5% of these 3234 candidates forfeited their deposits. From 1951 to 2014, a total of 97.92% of the independent candidates forfeited their deposits adding credence to the charge that a large number of these candidates are non-serious candidates.
| Year | Number of Independent Candidates | Number of Independent Candidates who forfeited their deposit | Percentage of Independent candidates who forfeited their deposit |
|---|---|---|---|
| 1951 | 533 | 360 | 67.54% |
| 1957 | 481 | 324 | 67.36% |
| 1962 | 479 | 378 | 78.91% |
| 1967 | 866 | 747 | 86.26% |
| 1971 | 1134 | 1066 | 94.00% |
| 1977 | 1224 | 1190 | 97.22% |
| 1980 | 2826 | 2794 | 98.87% |
| 1984 | 3894 | 3830 | 98.36% |
| 1989 | 3713 | 3672 | 98.90% |
| 1991 | 5546 | 5529 | 99.69% |
| 1996 | 10636 | 10604 | 99.70% |
| 1998 | 1915 | 1898 | 99.11% |
| 1999 | 1945 | 1928 | 99.13% |
| 2004 | 2385 | 2370 | 99.37% |
| 2009 | 3831 | 3806 | 99.35% |
| 2014 | 3234 | 3218 | 99.51% |
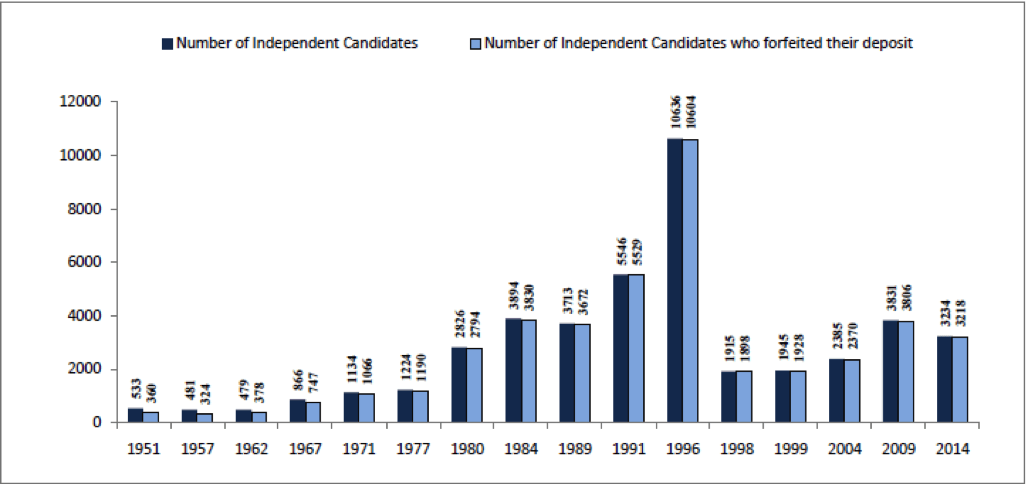
(Any candidate who secures less than 1/6th of the total valid votes polled in a constituency will forfeit the security deposit paid)
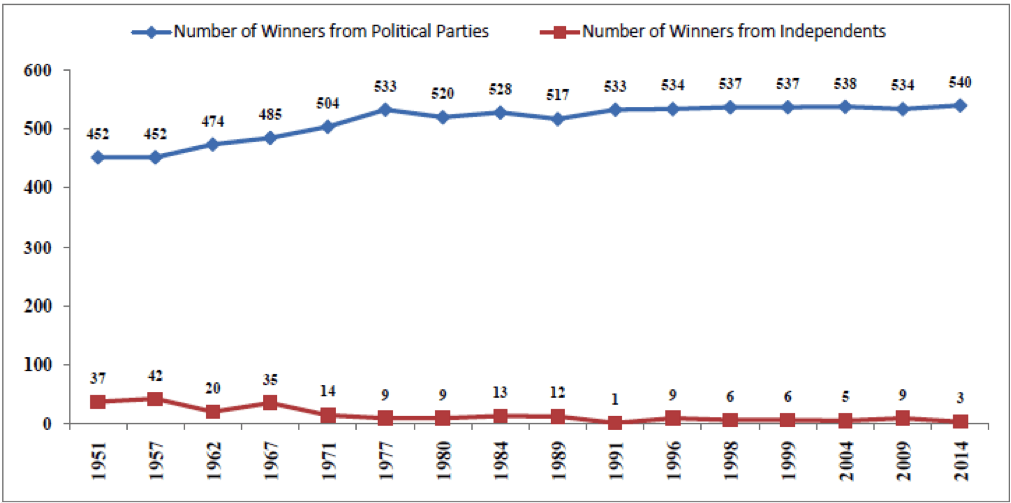
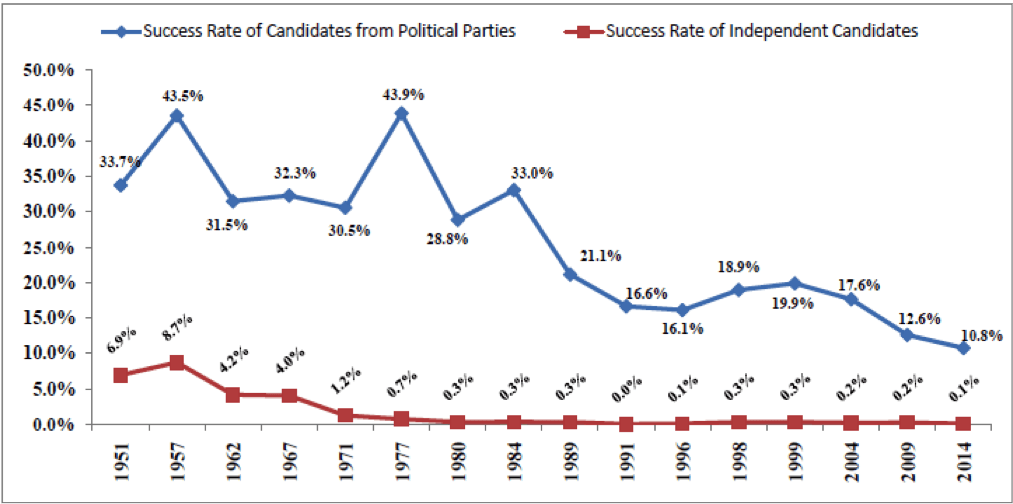
Independent Candidates & Success
The ability of independent candidates to win an election always had a question mark and the numbers don’t prove otherwise. In all the General elections since 1951, independent candidates could win only 3% of the total seats and their success rate (Number of winners/Number of contestants) has been a mere 0.5%.
| Year | Total No of Contestants | Total Number of seats | Number of Independent Candidates | Number of Winners from Independents | Success Rate of Candidates from Political Parties | Success Rate of Independent Candidates |
|---|---|---|---|---|---|---|
| 1951 | 1874 | 489 | 533 | 37 | 33.7% | 6.9% |
| 1957 | 1519 | 494 | 481 | 42 | 43.5% | 8.7% |
| 1962 | 1985 | 494 | 479 | 20 | 31.5% | 4.2% |
| 1967 | 2369 | 520 | 866 | 35 | 32.3% | 4.0% |
| 1971 | 2784 | 518 | 1134 | 14 | 30.5% | 1.2% |
| 1977 | 2439 | 542 | 1224 | 9 | 43.9% | 0.7% |
| 1980 | 4629 | 529 | 2826 | 9 | 28.8% | 0.3% |
| 1984 | 5492 | 541 | 3894 | 13 | 33.0% | 0.3% |
| 1989 | 6160 | 529 | 3713 | 12 | 21.1% | 0.3% |
| 1991 | 8749 | 534 | 5546 | 1 | 16.6% | 0.0% |
| 1996 | 13952 | 543 | 10636 | 9 | 16.1% | 0.1% |
| 1998 | 4750 | 543 | 1915 | 6 | 18.9% | 0.3% |
| 1999 | 4648 | 543 | 1945 | 6 | 19.9% | 0.3% |
| 2004 | 5435 | 543 | 2385 | 5 | 17.6% | 0.2% |
| 2009 | 8070 | 543 | 3831 | 9 | 12.6% | 0.2% |
| 2014 | 8251 | 543 | 3234 | 3 | 10.8% | 0.1% |
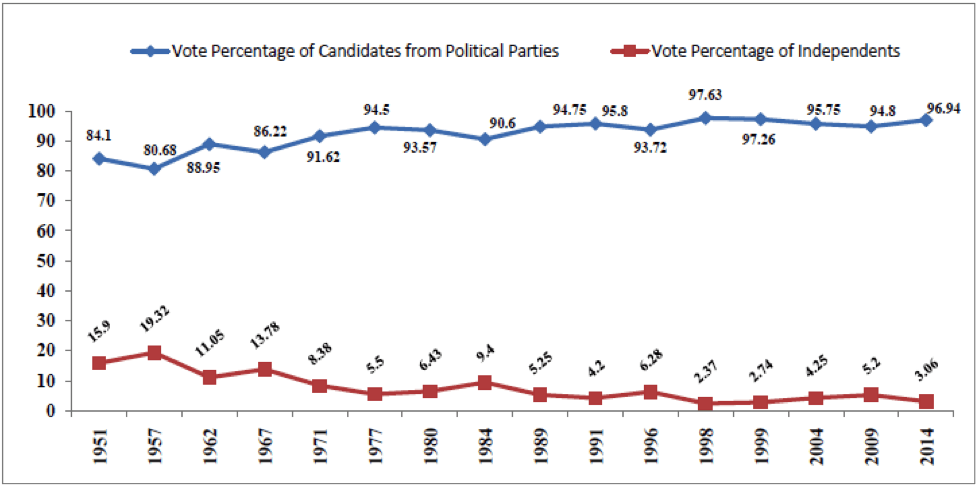
Independent Candidates & Vote Percentage
Independent Candidates polled more than 10% of the total valid vote in the first four general elections. After that, their vote percentage saw a steady decline and in 2014, they polled just 3% of the total vote.
| Year | Vote Percentage of Candidates from Political Parties | Vote Percentage of Independents |
|---|---|---|
| 1951 | 84.1 | 15.9 |
| 1957 | 80.68 | 19.32 |
| 1962 | 88.95 | 11.05 |
| 1967 | 86.22 | 13.78 |
| 1971 | 91.62 | 8.38 |
| 1977 | 94.5 | 5.5 |
| 1980 | 93.57 | 6.43 |
| 1984 | 90.6 | 9.4 |
| 1989 | 94.75 | 5.25 |
| 1991 | 95.8 | 4.2 |
| 1996 | 93.72 | 6.28 |
| 1998 | 97.63 | 2.37 |
| 1999 | 97.26 | 2.74 |
| 2004 | 95.75 | 4.25 |
| 2009 | 94.8 | 5.2 |
| 2014 | 96.94 | 3.06 |
What did the Law Commission Recommend?
Looking at the ahove numbers, it does look like the Law Commission got its recommendation right when it said that independents be debarred from contesting elections since it is not difficult to register a political party. The Law Commission recommended that independent candidates be barred from contesting in Parliament & Assembly elections and that Section 4, Section 5 of the Representation of People’s Act be amended accordingly.
Data Sources:
Election Commission of India Statistical Reports
Law Commission of India, 255th Report on Electoral Reforms