India way behind China in International Patents
[orc]In part 2 of this series on research in India, we compare the International patent applications from India with the BRICS nations and the USA. India is far behind China both in terms of patent applications & grants. China files 35 times more patent applications than India and is also granted 35 times more patents than India.
With the launch of ‘IMPRINT India’, there is a renewed debate about research in India. In Part 1, we looked at the details of this new initiative and also the patent filing numbers in India. In this piece, we look at Indian Patent filing in the international arena (WIPO) and how it compares with the BRICS nations and the USA.
Number of Patent Applications
According to the data available with the World Intellectual Property Organization (WIPO), China and USA are way ahead of India in the number of international patent applications. In the five years from 2009 to 2013, China has seen tremendous growth from 2.4 lakh applications in 2009 to 7.34 lakh applications in 2013. This is more than 200% rise. In the same time, USA has grown from 3.97 lakh applications in 2009 to 5.01 lakh applications in 2013, a 25% growth. India on the other hand has grown from 11939 applications in 2009 to 20908 applications in 2013, representing a 75% increase. Among the BRICS nations, India comes third after China & Russia. South Africa is at the bottom among the BRICS nations.
| Number of International Patent Applications filed (Data from WIPO) | |||||
|---|---|---|---|---|---|
| Origin Country | 2009 | 2010 | 2011 | 2012 | 2013 |
| China | 241434 | 308326 | 436170 | 561408 | 734096 |
| United States of America | 397919 | 433199 | 440632 | 473489 | 501162 |
| Russian Federation | 28859 | 32837 | 31464 | 34379 | 34067 |
| India | 11939 | 14869 | 15896 | 18202 | 20908 |
| Brazil | 5420 | 5735 | 6359 | 6603 | 6848 |
| South Africa | 1964 | 1996 | 1763 | 1688 | 2211 |
India was at the 21st place in the world in 1999 in the number of patents applications filed. And India is at the 11th place since 2010. In terms of patent grants, India is at the 26th place in 2013.
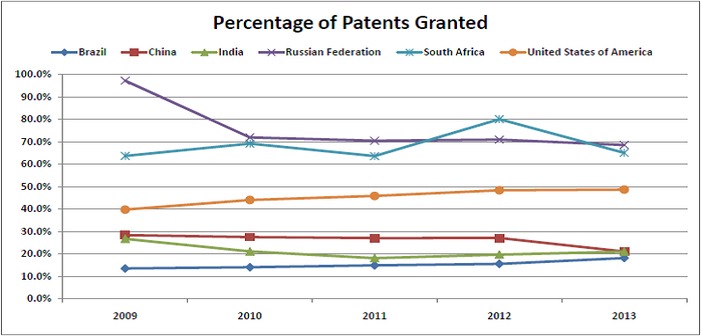
Number of Patent Grants
Interestingly, Russia & South Africa are way ahead of the other nations in the percentage of patents granted to the patent applications filed. Russia has a close to 70% grant rate in all the years while South Africa is a close second. USA has a grant rate in the high forties that steadily grew from 2009 to 2013. While India is far behind China in the number of patent applications filed, it is not that far behind in the grant rate. China’s grant rate has seen a continuous decline, from 28.4% in 2009 to 21% in 2013. India on the other hand started at 26.7% in 2009 and fell down to 21% in 2013. The worst grant rate is for Brazil with less than 20% in all the years. So while China has been increasing the number of patent applications at a fierce pace, the grants have not kept the same pace.
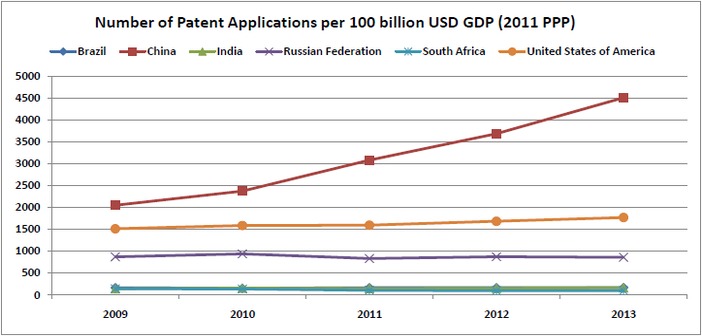
Patent Applications by GDP & Population
Based on the GDP figures (2011 PPP), China again leads the pack in the number of patent applications per 100 billion USD. China started at around 2000 applications per 100 billion in 2009 and went up to 4500 applications per 100 billion in 2013. China is closely followed by USA in the second place. USA started at around 1500 applications per 100 billion in 2009 and went up to 1770 in 2013. India is 4th among the BRICS nations, only ahead of South Africa. From 143 applications per 100 billion USD in 2009, India went up to 163 in 2013. Brazil is also ahead of India in this aspect.
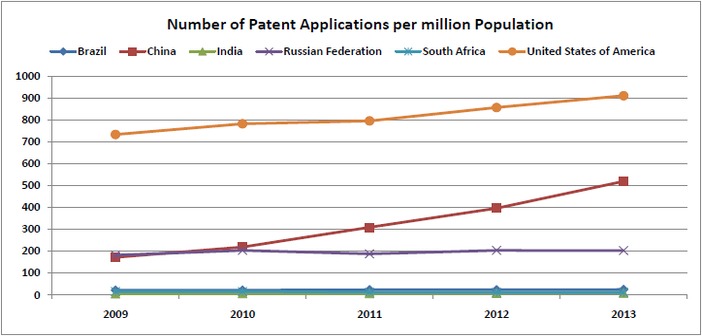
As expected, India is at the bottom when it comes to number of patent applications per million population. India started at 6 applications per million population in 2009 and went up to 9 in 2013. China on the other hand started at 172 applications per million in 2009 and went up to 519 in 2013. In other words, China files 50 times more applications per million population compared to India. USA is on the top, thanks to the lower population. From 733 applications per million population in 2009, USA went up to 910 applications per million in 2013. Russia also has a healthy rate in the 3 digits while Brazil & South Africa are in the two digits. India is the only country among the six to have a single digit, owing to the high population.
Indian Patent Grants by Technology
As expected, the most patent applications & grants from India are in the fields of Computer Technology & Pharmaceuticals. The top ten sectors include Organic Chemistry, Digital Communication, Telecommunications, Bitechnology etc.
| Number of Patent Grants by Technology (WIPO Data) | |||||
|---|---|---|---|---|---|
| Technology | 2009 | 2010 | 2011 | 2012 | 2013 |
| Computer technology | 125 | 455 | 537 | 727 | 1069 |
| Pharmaceuticals | 239 | 263 | 232 | 335 | 356 |
| Organic fine chemistry | 256 | 260 | 288 | 338 | 336 |
| Digital communication | 25 | 83 | 88 | 126 | 197 |
| Telecommunications | 20 | 55 | 54 | 98 | 111 |
| Basic communication processes | 32 | 81 | 55 | 65 | 99 |
| Biotechnology | 73 | 93 | 87 | 81 | 89 |
| Basic materials chemistry | 49 | 47 | 51 | 73 | 87 |
| Audio-visual technology | 11 | 29 | 43 | 65 | 84 |
| Measurement | 20 | 38 | 38 | 60 | 84 |