Understanding ‘The index of Industrial Production (IIP)’ & Eight Core Industries
The index of Industrial Production (IIP) conveys the status of production in the industrial sector of an economy in a given period of time, in comparison with a fixed reference point in the past. The IIP numbers, in India use 2004-05 as the base year for comparison.
[orc]The current Index of Industrial Production (IIP) with base 2004-05 has a broader coverage of 682 items comprising 61 from Mining & Quarrying, 620 from Manufacturing and 1 from Electricity Sector having the weightage of 14.16%, 75.53% and 10.32% respectively in the all-India IIP.
IIP is compiled using data received from 16 source agencies viz. Department of Industrial Policy & Promotion (DIPP); Indian Bureau of Mines; Central Electricity Authority; Joint Plant Committee; Ministry of Petroleum & Natural Gas; Office of Textile Commissioner; Department of Chemicals & Petrochemicals; Directorate of Sugar; Department of Fertilizers; Directorate of Vanaspati, Vegetable Oils & Fats; Tea Board; Office of Jute Commissioner; Office of Coal Controller; Railway Board; Office of Salt Commissioner and Coffee Board.
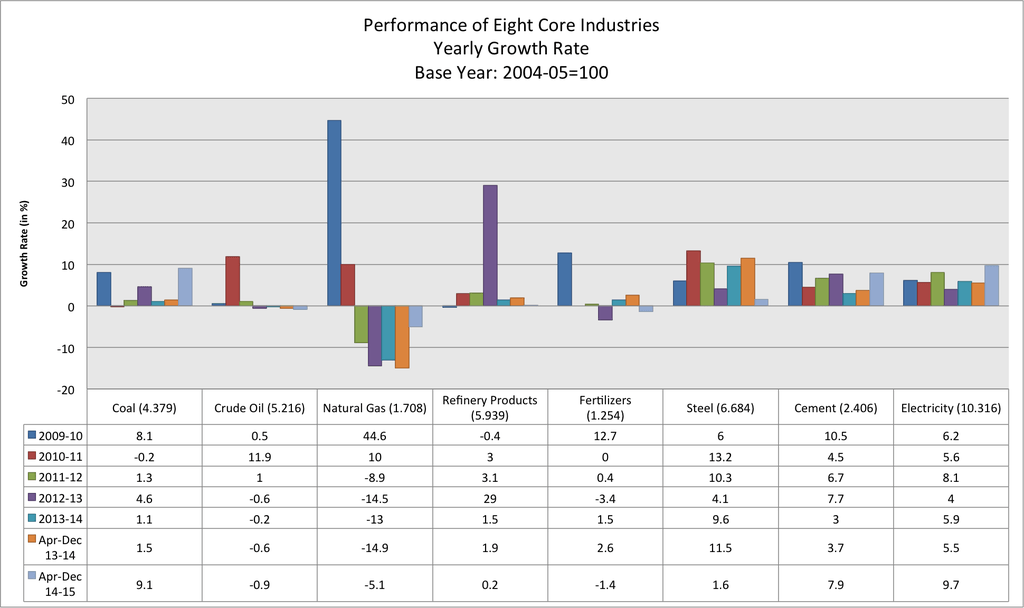
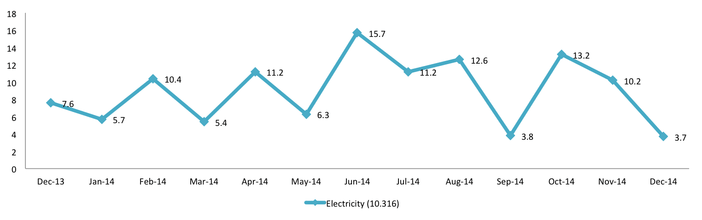
The Eight Core Industries comprise nearly 38 % of the weight of items included in the Index of Industrial Production (IIP). They are Coal, Crude Oil, Natural Gas, Petroleum Refinery Products,Fertilizers,Steel, Cement & Electricity.
The combined Index of Eight Core Industries stands at 172.7 in December,2014, which is 2.4 % higher compared to the index of December, 2013. Its cumulative growth during April to December, 2014-15 was 4.4 %.


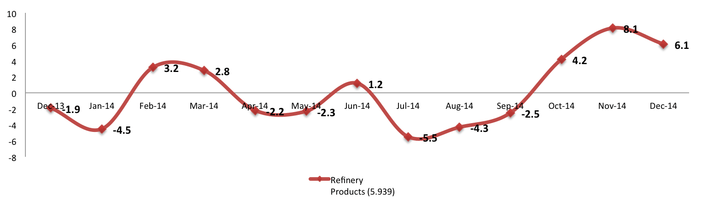
Petroleum Refinery production (weight: 5.94%) increased by 6.1 % in December, 2014. Its cumulative index during April to December, 2014-15 increased by 0.2 % over the corresponding period of previous year.


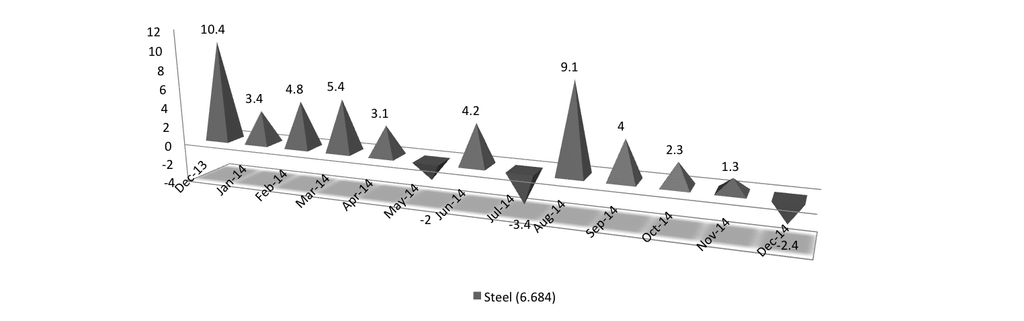
Steel production (weight: 6.68%) declined by 2.4 % in December, 2014. Its cumulative index during April to December, 2014-15 increased by 1.6 % over the corresponding period of previous year.


Source: Release of the Ministry of Commerce & Industry, 02-February-2015 , Press Information Bureau, Government of India & MOSPI (Ministry of Statistics & Programme Implementation)