Fact Check: Has India attracted more FDI in the last few years?

[orc]In an infographic published on the 48-Month portal, the government made certain claims about attracting foreign investment and driving economic growth. Here is a fact check of these claims.
In an infographic published on the 48-Month portal, the government made certain claims about attracting foreign investment and driving economic growth. Here is a fact check of these claims.


What about FDI Equity flow?
The first claim is that FDI equity flow has gone up by 47%. The OECD defines FDI flows as the ‘value of cross-border transactions related to direct investment during a given period of time, usually a quarter or a year. Financial flows consist of equity transactions, reinvestment of earnings, and intercompany debt transactions. Outward flows represent transactions that increase the investment that investors in the reporting economy have in enterprises in a foreign economy, such as through purchases of equity or reinvestment of earnings. Inward flows represent transactions that increase the investment that foreign investors have in enterprises resident in the reporting economy. FDI flows are measured in USD and as a share of GDP.’
The claim is vague in terms of defining the years of comparison for FDI equity flow. Assuming that the claim refers to inflows and the years of comparison are the same as the ones for the next claim (i.e. 2013-14 and 2016-17), the percentage increase in FDI equity inflow is 79%. The FDI equity inflow in 2013-14 is USD 24.299 billion and in 2016-17 is USD 43.478 billion. Hence it is not true. If we consider different combinations of base year and comparison year, the numbers vary greatly between 40% to 77% but none of them add up to 47%. The numbers can be corroborated from different sources including the data published by Department of Industrial policy and Promotion, and answers provided in the Lok sabha on 19th March and 23rd July of 2018.
Claim: FDI equity flow has gone up by 47%.
Fact: The claim is very vague and the available data does not corroborate this number. Hence the claim is FALSE.
Has FDI inflow increased substantially?
The second claim in the infographic is that there has been a rise from 36.05 billion USD in 2013-14 to 60.08 billion USD in 2016-17. Though the claim does not particularly explain what these numbers refer to, they correspond to India’s Gross Foreign Direct Investment (Gross FDI). The reserve bank of India maintains & publishes the ‘Foreign Investment Flows’ data every year.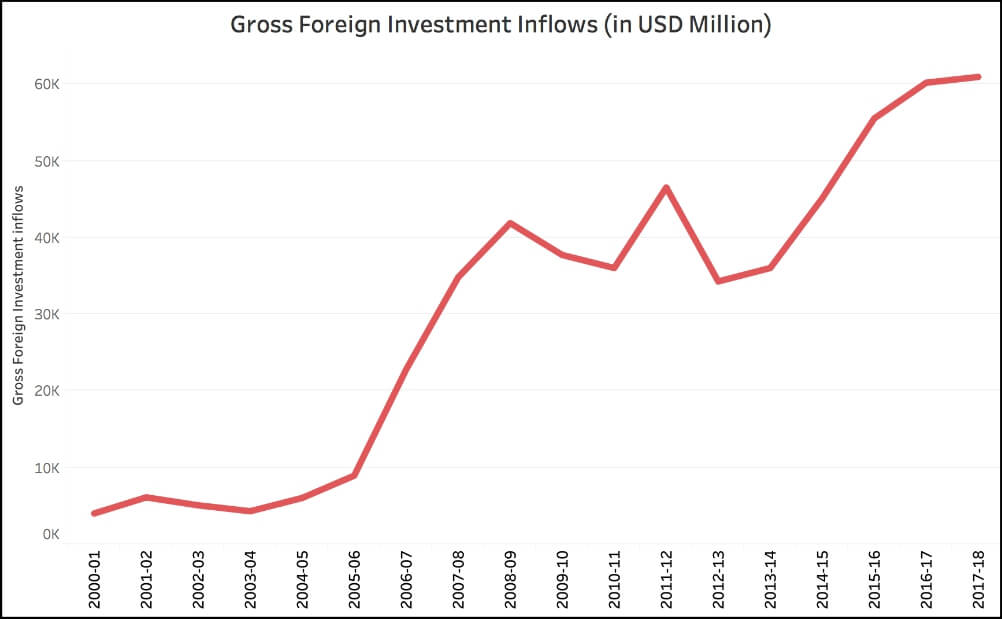


What about FDI to GDP ratio?
Another important indicator to comprehensively understand the trend in FDI inflows is the FDI to GDP ratio. This is essential to understand if the FDI inflows are keeping pace with the growth in economy. World Bank data updated in September of 2018 shows a decreasing trend in the last few years. This ratio was the greatest during UPA-1 (3.7) just before the global financial crisis. The FDI to GDP ratio in 2017 is the 2nd lowest after 2005. Further, there have been changes to the FDI policy in recent times where the FDI cap was increased in multiple sectors which could have contributed to increase in gross FDI.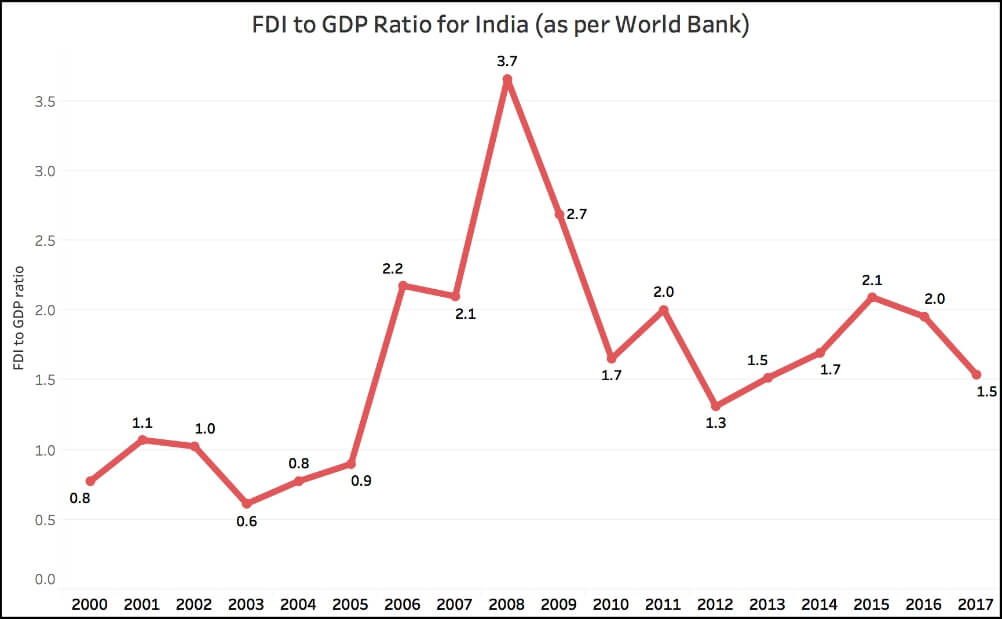
Claim: There has been a rise from 36.05 billion USD in 2013-14 to 60.08 billion USD in 2016-17
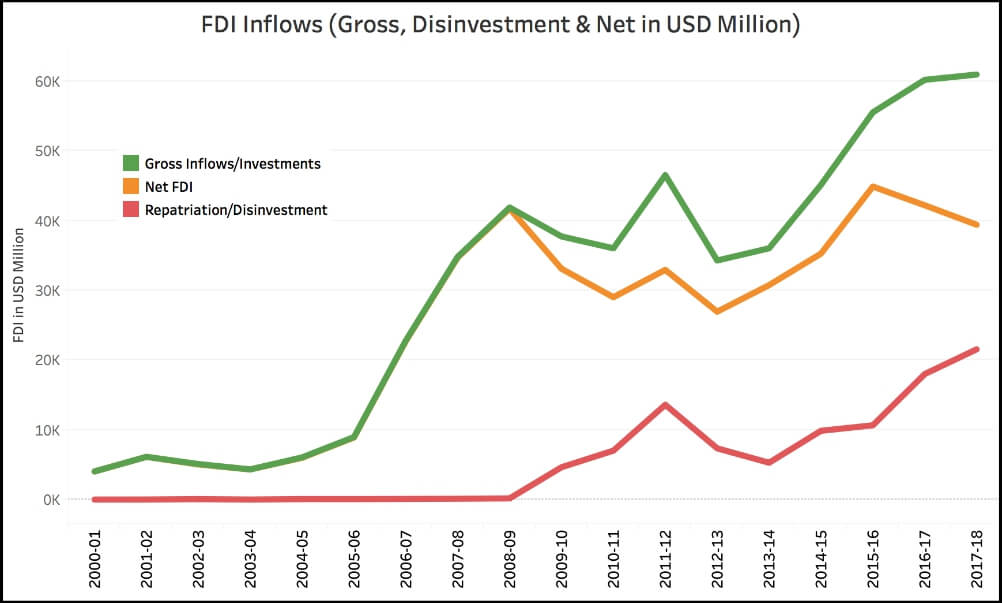
Fact: Assuming that the numbers correspond to India’s Gross Foreign Direct Investment, the claim is TRUE. However, India’s net FDI inflows and the FDI to GDP ratio have decreased in the last two years
This story is part of a larger series on the 4-years of the Modi government. This series has been made possible with the flash grant of the International Fact Checking Network (IFCN). Read the rest of the stories in this series here.