Data: What is India’s trade with China like?
Ever since the outbreak of COVID-19 with its origin in Wuhan (China), there have been renewed demands for ban of Chinese goods and for reducing trade with China. But as data suggests, it is easier said than done. Here is why.
International trade is one of the areas that has been severely hit by COVID-19 and most of the countries reliant on export & import of goods & services are bearing the brunt.
As far as India is concerned, as per a press release in June 2019 by Ministry of Commerce and Industry, India holds 2.1% share of the global exports and 2.6% share of the global imports as on 2017. Some of the leading trade partners of Inia include – USA, China, UAE, Saudi Arabia, Hong Kong etc.
As China is the country of origin for COVID-19, there are increasing questions over China’s reluctance to share information about the initial outbreak. Because of this, there has been a diplomatic backlash with many countries threatening to move out their manufacturing facilities from China. There have also been statements from global leaders to relook their trade relations with China.
Even in India, there have been demands from certain quarters along with some public support to ban trading with China. But this is easier said than done. In this story, we look at the extant of trade with China and India’s dependence on the same. For the analysis, we have majorly relied on the information provided on Ministry of Commerce and Industry’s Export & Import Data Bank.
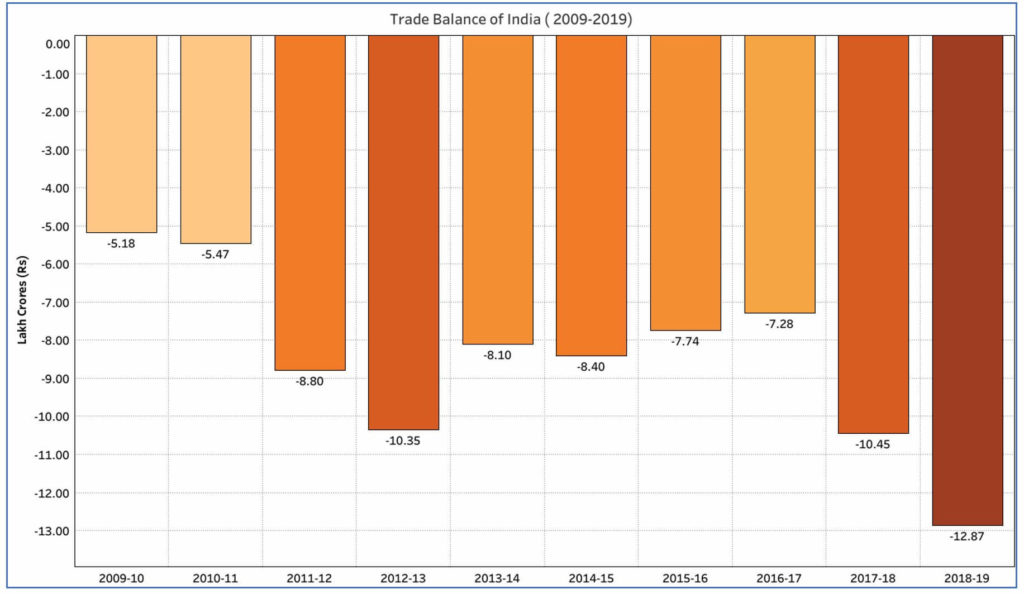
Highest Trade Balance Deficit in last financial year over the 10-year period.
Trade balance is the difference between the total monitory value of the exports and the imports. For balance of trade, only the visible goods are considered, and the services excluded.
When the value of exports exceeds the value of imports, it is referred to as Trade Surplus. Whereas if the value of imports is higher than that of the exports, it is referred to as Trade Deficit. Since independence, India generally had a trade deficit. However, the value has varied over the years.
For 2018-19, the trade deficit was ₹12.86 lakh crores. This is the highest for the preceding 10-year period (2010-19). Prior to this, the previous financial year i.e. 2017-18 accounted for the highest trade deficit of ₹10.45 lakh crores. The previous highest can be traced back to 2012-13, when the deficit was ₹ 10.34 crores. This was followed by 4 years of reduced trade deficit, of which the least being in 2016-17 with ₹ 7.28 lakh crores.

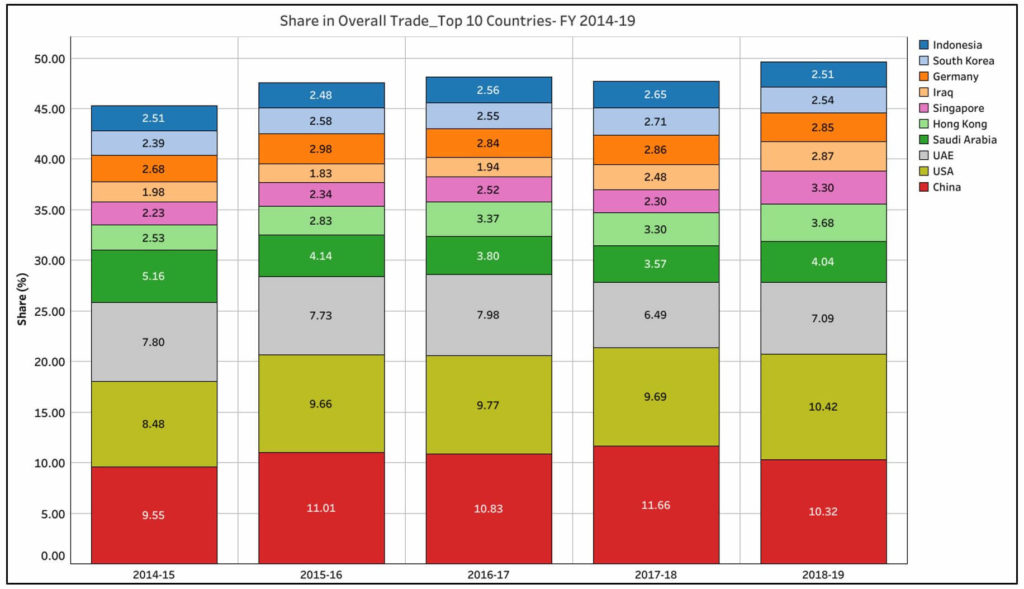
In 2018-19, USA emerged as India’s leading trade partner, overtaking China
For 2018-19, USA had a share of 10.42% of the total trade by India (including both imports and exports), an increase from the previous year’s 9.69%. This is higher than that of China which accounts for 10.32% of the total share of international trade conducted by India.
Until the previous year, China had the highest share in India’s global trade. China’s share in the previous 4 years i.e. between 2014-18 was 9.55%, 11.01%, 10.83% and 11.66% respectively. The increase in USA’s share can be attributed to an increase in both the imports and the exports. For the year 2018-19, the share of USA in exports was 15.88%, a marginal increase from 15.77% recorded in the previous year. The significant increase was observed in the share of imports which increased from 5.72% in 2017-18 to 6.91% in 2018-19. Over the five-year period (2014-19), USA’s share in imports and exports has gradually increased from 4.87% and 13.68% respectively in 2014-15.
Meanwhile, a significant drop in the share of China’s imports into India was observed in 2018-19. In 2018-19, imports from China accounted for 13.69% of the total, significantly less than the 16.4% in 2017-18. Meanwhile, there is an increase in share of exports to China, which stood at 5.08% in 2018-19, compared to 4.4% the previous year.
Among the other significant trading partners, although UAE’s share in overall trade has increased in 2018-19, compared to 2017-18, its share is still less that of the earlier years.
Meanwhile, over the five-year period (2014-19), the share of Saudi Arabia in overall trade has reduced from 5.16% to 4.04%. While the volume and share of imports from Saudi Arabia has increased, the same increase isn’t observed in the case for the exports to Saudi Arabia. Hong Kong, Singapore and Iraq are among the other countries which have witnessed increasing trade with India.

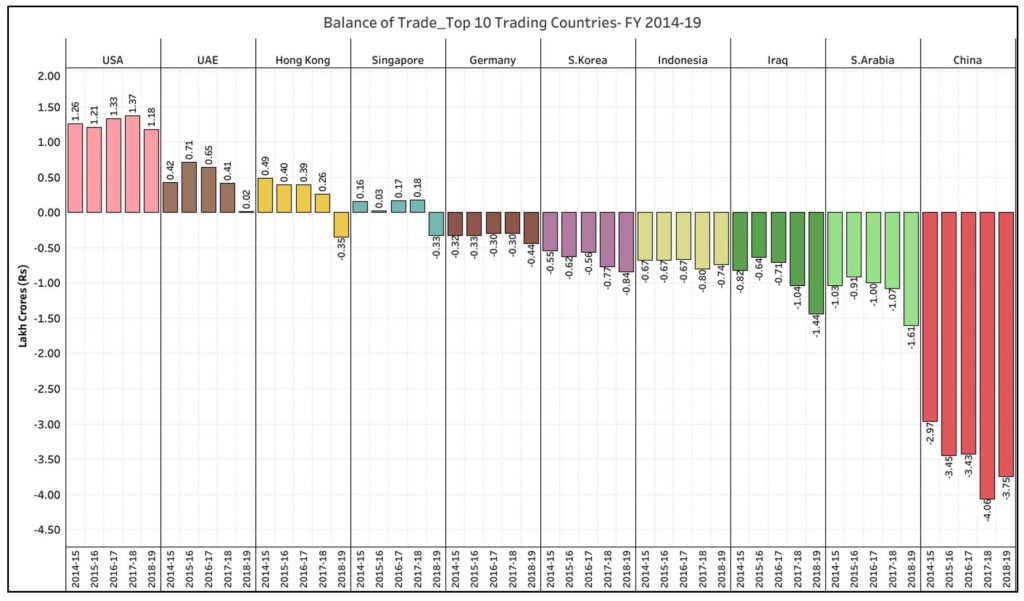
India has the highest trade deficit with China and a surplus with USA & UAE
Among the countries which have the higher volumes of trade with India, India’s trade surplus is with only USA and UAE during the five-year period of 2014 to 2019.
Hong Kong and Singapore, with who India had a trade surplus previously also recorded a trade deficit for 2018-19. One of the key reasons for having a favourable trade balance with USA is the high value exports of semi-precious metals and pearls. So is the case with UAE, where the value of exports for these commodities is high.
Meanwhile, the increase in the import of organic chemicals, plastics, mineral oils & products etc. from Hong Kong has resulted in the negative trade balance for 2018-19. Import of these products along with electrical machinery are the reasons for a trade deficit with Singapore.
In case of the other top countries with which India trades, it has a trade deficit. An increase in this deficit year on year with many of these countries is observed.
While India has managed to reduce the trade deficit with China in 2018-19 compared to the previous year, it is still very high at ₹ 3.75 lakh crores. In the previous year i.e. 2017-18, the trade deficit with China was ₹4.06 lakh crores.
As highlighted earlier, the increase in imports from Saudi Arabia is higher than the increase in exports, resulting in an increased trade deficit. So is the case for other countries like Iraq & South Korea where the rate of increase in imports is higher than that of exports.
The trends with these major trading partners point towards a higher rate of increase in imports compared to that of the exports across the board.

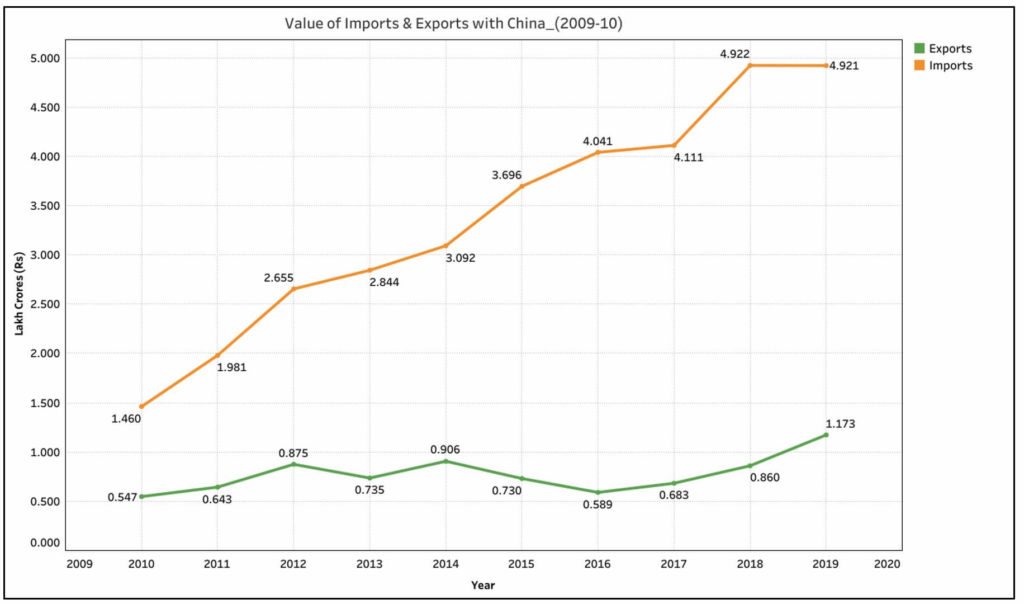
Marginal fall in imports from China in 2018-19, after more than 3-fold increase over a ten-year period
In 2009-10, the total value of imports from China was ₹ 1.46 lakh which increased steadily to ₹ 4.922 lakh crores in 2017-18. The year 2017-18 also marked the single largest one-year increase in the worth of imports with an increase of ₹ 0.81 lakh crores compared to the previous year. The value of imports from China, fell only marginally i.e. by around ₹157 crores in 2018-19, amounting to a total of Rs 4.92 lakh crores.
Meanwhile, the value of exports to China has crossed ₹1 lakh crore for the first time in 2018-19 with ₹1.173 lakh crores. The previous highest was in the year 2013-14, where the value of exports was ₹ 90.6 thousand crores. The commodities which have contributed towards this increase include – Organic Chemicals, Fish & Aquatic invertebrates, Coffee, Tea etc.
The huge deficit of trade with China, has a major impact on India’s overall trade deficit due its sheer volume. The country with the next highest value if imports into India in 2018-19 was USA, where the imports amounted to a total of ₹ 2.485 lakh crores i.e. just over half the volume of imports from China.

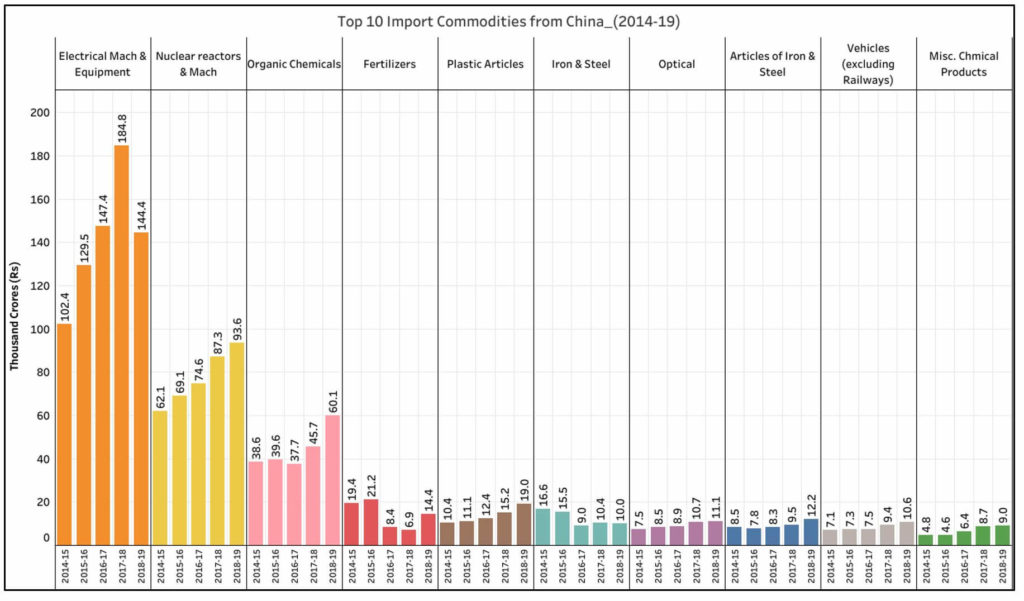
Electrical Equipment, Nuclear Reactors, Organic Chemicals among the top imports from China
A major share of the imports from China include Electrical Machinery and Equipment, which includes electronic items also. In 2018-19, ₹ 144.4 thousand crores worth of goods were imported under this category. The marginal fall in the imports from China in 2018-19 as indicted earlier can be attributed to a major extent to this commodity. In the previous year, the total worth of Electrical machinery and equipment was ₹ 184.8 thousand crores.
Nuclear Reactors, Machinery, appliances etc. are the second most imported items by India from China. These imports have a year on year consistent increase. For 2014-15, the worth of imports was ₹ 62.1 thousand crores which gradually increased to ₹ 93.6 thousand crores in 2018-19.
Organic Chemicals also form a substantial part of the imports from China and have seen an increase in their value. In 2018-19, ₹ 60.1 thousand crores of organic chemicals were imported, while five years back i.e. in 2014-15, they were worth ₹ 38.6 thousand crores. These three commodities occupy a major share of the imports compared to others. Other major imports into India from China include – Fertilizers, Plastic articles, Iron & Steel, Optical, Articles made of Iron & Steel, Vehicles (excluding railway related), Misc. Chemical products etc.
Barring a dip in the value of Iron & Steel, the worth of most of the other top imports into India has increased.
India still hugely reliant on China for import of multiple commodities
In the year 2018-19, 96 different types of commodities were imported into India from China. As highlighted earlier, the fall in volume is very marginal in 2018-19 compared to that of previous year. However, in terms of share of imports, the reduction is significant. In 2018-19, the total share of imports from China is 13.69%, compared to that of 16.4% the previous year. USA and Singapore have increased their share of imports into India.
While there is a fall in the import of Electrical machinery and equipment from China in 2018-19, it has been compensated from countries like Vietnam, Hong Kong, Singapore and few European countries like Belgium & Netherlands. However, their share even for this commodity is quite low with the volume of Electrical equipment imported from China being many times higher.
The nature of most of the top imports from China are not final consumables but are used in various commercial activities including agriculture and manufacturing. For instance, most of the electronic spare parts used in assembling electronic goods in India are imported from China.
Any disruption in these imports could adversely affect the manufacturing and agricultural sectors in India.
As it exists, any ban of imports from China could lead to more trouble unless India finds other sources of import for similar items or augment domestic availability. Finding alternates overnight will also be a challenge because of the sheer volume. Hence, despite demands for ban of trade with China or ban of Chinese goods, it may not happen without finding the right alternatives.
Featured Image: India’s trade with China