AQI in India: Why the Deepawali Period Leads to Debates around Air Pollution
TL;DR As the lights of Deepawali illuminated India’s cities, the nation’s air turned darker. Between October 19–22, 2025, the average Air Quality Index (AQI) across major metros spiked sharply, especially in Delhi, where levels rose from 296 (pre-Diwali) to 353 (post-Diwali). Despite bans and “green cracker” campaigns, data from the Central Pollution Control Board (CPCB) shows that India’s air quality remains trapped in a cycle of weak enforcement and flawed monitoring. Delhi continues to rank among the world’s most polluted capitals, with AQI levels 25–30X higher than the WHO’s safe limit.
Context
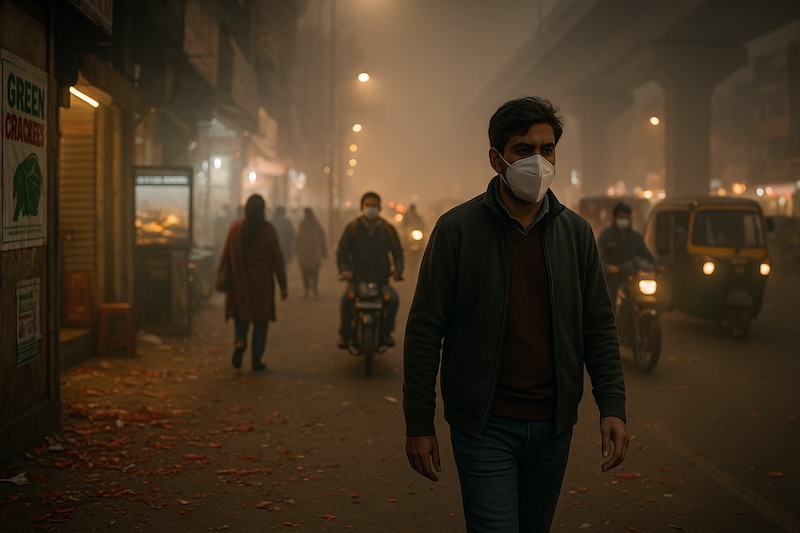
Each year, Deepawali marks both celebration and suffocation for India’s metros. As cities light up with fireworks, the air fills with fine particulate matter, PM2.5 and PM10, triggering sharp overnight spikes in pollution. This year, Delhi, Lucknow, and Ahmedabad saw the steepest increases. While Chennai and Hyderabad maintained relatively cleaner air, northern cities bore the brunt of post-festival haze.
Meteorologically, the festival’s timing, at the onset of autumn, traps pollutants near the ground due to falling temperatures and stagnant winds. Combined with stubble burning in Punjab and Haryana, this creates a perfect storm of smog.
Despite the Supreme Court’s order restricting fireworks to green crackers and limiting use to 8–10 PM, enforcement remains inconsistent.
Who Compiles This Data?
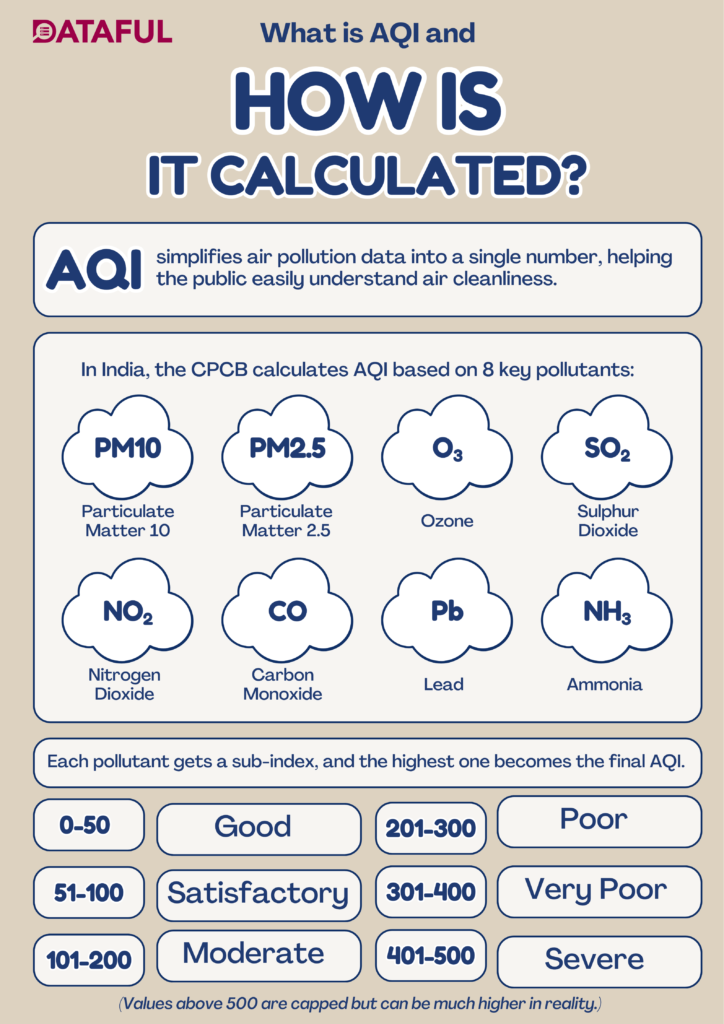
The Ministry of Environment, Forest and Climate Change collects and publishes the AQI data under the Central Pollution Control Board’s Daily AQI Bulletin.
Where can I download Clean & Structured Data on the AQI in India’s Cities & Towns?
Clean, structured, and ready-to-use datasets related to day-wise, state-wise Air Quality Index (AQI) of Major Cities and Towns in India can be downloaded from Dataful.

Key Insights
How India’s Metros Fared This Deepawali
India’s major cities witnessed a familiar trend this Deepawali: a sharp rise in pollution levels as fireworks and stagnant post-monsoon air combined to choke the atmosphere.
- Delhi saw AQI jump by nearly 20% post-festival, breaching the “very poor” category.
- Lucknow and Ahmedabad recorded the steepest spikes, both crossing 190 during festivities.
- Mumbai, though affected, showed a quick recovery thanks to strong coastal winds.
- Chennai and Hyderabad remained comparatively clean, aided by persistent rainfall that washed away suspended particles.
The Bigger Picture: India’s Most and Least Polluted Cities
| Rank | City | Annual Average AQI (2024) | Key Pollution Sources |
| 1 | Byrnihat, Meghalaya | 219 | Industrial emissions, vehicular traffic, and bowl-shaped terrain trapping pollutants |
| 2 | Sri Ganganagar, Rajasthan | 215 | Stubble burning, industrial and construction dust |
| 3 | Delhi, Delhi | 209 | Vehicle and industrial emissions, stubble burning, waste burning |
| 4 | Greater Noida, UP | 208 | Unpaved roads, construction dust, traffic emissions |
| 5 | Gurugram, Haryana | 189 | Road dust, construction, industrial activity, waste burning |
Meanwhile, smaller southern and coastal towns such as Thanjavur (42), Ramanathapuram (42), Palkalaiperur (36), Madikeri (35), and Tirunelveli (30) maintained AQI levels below 45, falling in the “Good” category.
The contrast underscores a clear divide; North India’s plains continue to suffer from dust, crop residue burning, and stagnant winter air, while Southern and coastal regions benefit from cleaner, moisture-rich atmospheres.
Why the System Fails: Gaps in Monitoring and Enforcement
Despite India’s expanding real-time air monitoring network, data quality and transparency remain chronic weak spots.
- Poor sensor placement: High-end monitors placed under tree covers or behind buildings, resulting in distorted readings.
- No third-party audits: Lack of third-party audits creates blind spots in national air data.
- Non-participation: Many CPCB stations don’t participate daily in the AQI recordings, creating data gaps.
Experts summarise India’s air quality governance as “data-rich but credibility-poor.” The CPCB lacks clear national guidelines for the placement and calibration of sensors, resulting in inconsistent results across states.
Seasonal Dynamics: Why Deepawali Makes It Worse
Deepawali coincides with the onset of autumn, when weather conditions inherently trap pollutants close to the surface.
- Temperature Inversion: Cooler air prevents pollutants from dispersing upward.
- Low Wind Speeds: Stagnant air fails to move particulate matter away.
- Dry Conditions: No rainfall to wash away pollutants through “wet deposition.”
- Added Load: Fireworks, stubble burning, and vehicular congestion spike PM2.5 and PM10 levels overnight.
Even without crackers, post-monsoon months (October–December) remain India’s most polluted quarter. Deepawali, layered atop these meteorological factors, simply amplifies the crisis.
Why Does It Matter?
Air pollution is no longer an “urban problem”, it’s a public health crisis. AQI levels above 300 are known to cause respiratory issues even in healthy individuals. For children, the elderly, and those with pre-existing conditions, even short exposure can be dangerous.
The World Health Organisation (WHO) sets safe annual limits for PM2.5 at 5 µg/m³. Delhi’s average in winter often crosses 125 µg/m³, 25 times higher than this threshold.
Without stricter enforcement, cleaner technologies, and genuine transparency in air-quality data, India’s festival of lights will continue to be shadowed by this debate around pollution.
Key Numbers (2025 Diwali Week, Metro Average)
- Pre-Diwali AQI (Oct 19): 149.6
- Diwali-Day AQI (Oct 21): 205.1
- Post-Diwali AQI (Oct 22): 153.6
- Most Polluted Cities 2024 (Average AQI): Byrnihat (219), Sri Ganganagar (215), Delhi (209), Greater Noida (208), and Gurugram (189)
- Least Polluted Cities 2024 (Average AQI): Thanjavur (42), Ramanathapuram (42), Palkalaiperur (36), Madikeri (35), and Tirunelveli (30)