[orc]The summary of the Agricultural Census of 2010-11 was released recently. The number of land holdings saw a rise while the average size of the land holding came down. This has been a consistent trend over the last few censuses. The only exception is the marginal increase in the total area under operation compared to 2005-06.
The Agricultural Census of 2010-11 was released recently. Agriculture Census forms part of a broader system of collection of Agricultural Statistics in India. It is a large-scale statistical operation for collection of requisite data and derivation of quantitative information about the structural characteristics of agriculture in the country. The basic unit of data collection in Agriculture Census is the operational holding. As per the latest census, close to 5% of all the agricultural land holdings account for about a third of all the agricultural land in operation.
What is the Agricultural Census?
Agriculture Census in India is conducted at five yearly intervals for collection of information about structural aspects of agricultural holdings in the country. The basic statistical unit for data collection is ‘Operational Holding’. The concept of agricultural operational holdings does not include those holdings which are not operating any agricultural land and are engaged exclusively in livestock, poultry and fishing etc. The reference year for the present Census was Agriculture Year 2010-11 (July-June). Agriculture Census data is collected in three phases. During Phase-I, data is collected on primary characteristics such as number and area of operational holdings. In Phase-II, detailed data is collected on sample basis from 20 percent villages covering characteristics such as tenancy, land use, irrigation, cropping pattern, dispersal of holding etc. During Phase-III, generally referred to as Input Survey, data is collected on pattern of use of inputs.
Number of Holdings & Average Size
As per Agriculture Census 2010-11, total number of operational holdings was estimated as 138.35 million. The total operated area was 159.59 million hectare. (1 Hectare is 2.47 acre & 1 acre is 4046 Sq.mtr)
The average size of the holding has been estimated as 1.15 hectare. The average size of holdings has shown a steady declining trend over various Agriculture Censuses since 1970-71.
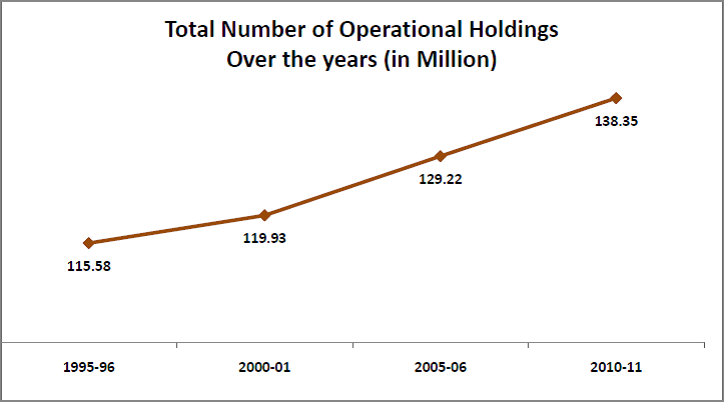
The number of agricultural operational holdings in the country has seen a steady increase over the years. From 115.58 million operational holdings in 1995-96, this number has increased to 138.35 million operational holdings in 2010-11, an increase of 20% over 16 years.
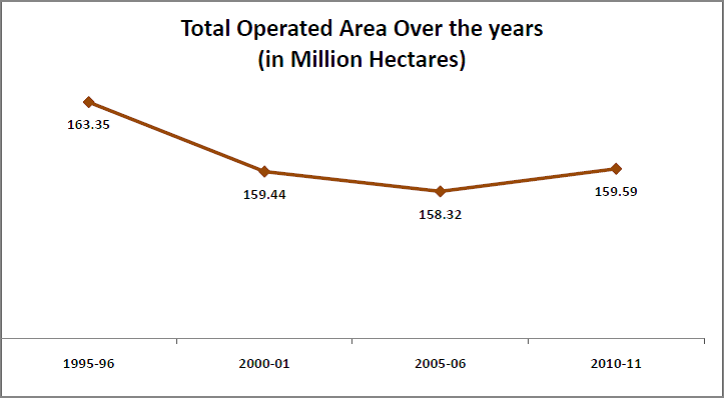
The total operated area has seen mixed trend. It reduced from 163.35 million hectares in 1995-96 to 158.32 million hectares in 2005-06. In 2010-11, it increased to 159.59 million hectares.
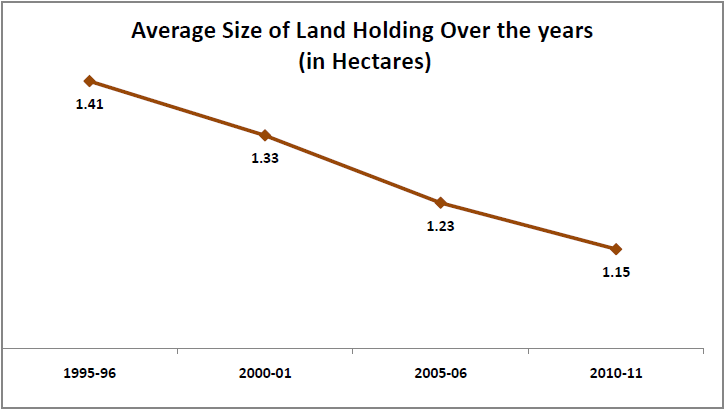
The average size of land holding has been continuously decreasing on account of increasing number of land holdings From an average of 1.41 hectares in 1995-96, it went down to 1.15 hectares in 2010-11, a decrease of 18%.
Category wise breakup of Land Holdings
On the basis of operated area, operational holdings in Agriculture Census are categorized as follows,
| Category | Operated Area |
|---|---|
| Marginal Holdings | Below 1 Hectare |
| Small Holdings | 1 to 2 Hectares |
| Semi-Medium Holdings | 2 to 4 Hectares |
| Medium Holdings | 4 to 10 Hectares |
| Large Holdings | 10 Hectares & above |
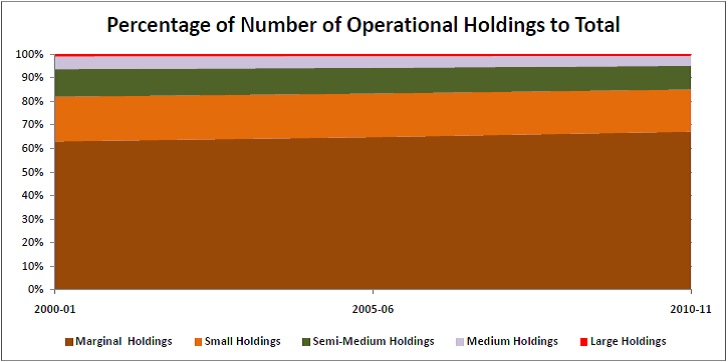
The percentage of marginal holdings has gone up from 62.9% in 2000-01 to 67.1% in 2010-11. Except the percentage of marginal holdings, the percentage of all other holdings has gone down marginally from 2000-01 to 2010-11. The percentage of large holdings has gone down from 1% in 2000-01 to 0.7% in 2010-11. The percentage of medium holdings went down from 5.3% in 2000-01 to 4.3% in 2010-11.
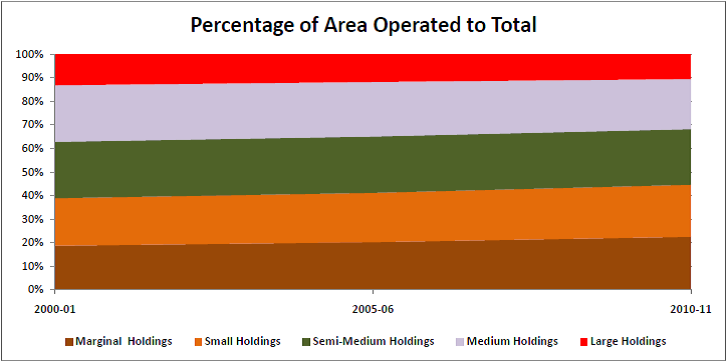
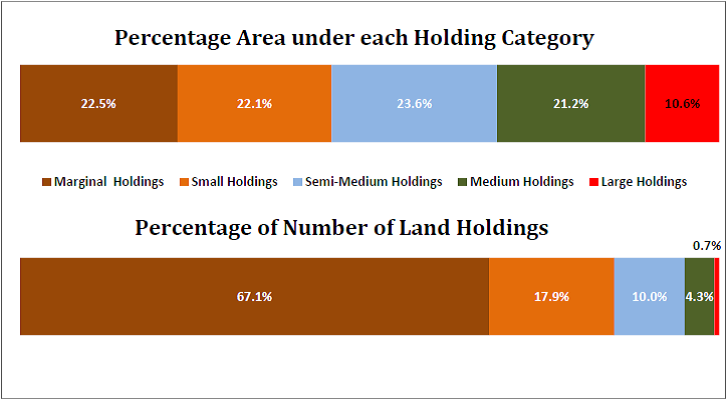
Going with the trend of percentage of land holdings, the percentage of area operated increased for marginal holdings and decreased for all other categories except small holdings. Surprisingly, though the percentage of small land holdings has gone down from 18.9% in 2000-01 to 17.9% in 2010-11, the percentage area under small land holdings increased from 20.2% in 2000-01 to 22.08% in 2010-11. This could be probably because of the increase in total area under operation. The percentage area under marginal land holdings increased from 18.7% in 2000-01 to 22.5% in 2010-11.
Less than 5% land holdings account for close to 1/3rd of total area
While the number of Medium & Large holdings account for less than 5%, they make up for close to 1/3rd of the total area under operation. Though the number of Marginal & Small holdings account for 85% of the total number of holdings, they together account for only 45% of the total area under operation.
Featured Image: By ILRI (Ploughing with cattle in West Bengal) [CC BY 2.0], via Wikimedia Commons


2 Comments
Useful data , Thank You
Pingback: How Are Power Tillers a Boon to the Indian Farmers?