(26 September 2022) Government Data Roundup: NLEM 2022, 1st advance estimates Kharif crops, IIP for July 2022, CPI/CFPI/WPI for August 2022 among the data released recently.
In the twelfth edition of the ‘Government Data Roundup’, we cover NLEM 2022, 1st advance estimates of Kharif crops, IIP for July 2022, CPI/CFPI/WPI for August 2022, EPFO payroll data, Handbook of Statistics on Indian Economy 2021-22 among others.
The twelfth edition of the fortnightly government data roundup covers the National List of Essential Medicines (NLEM) 2022, National Logistics Policy 2022, Draft Indian Telecommunication Bill 2022, First Advance estimates of production of major Kharif crops, Index of Industrial Production for July 2022, Consumer Food Price Index (CFPI) for Rural and Urban for August 2022, Wholesale Price Index for August 2022, CPI for Agricultural and Rural Labourers for August 2022, EPFO Payroll data and Handbook of Statistics on Indian Economy 2021-22 by the Reserve Bank of India (RBI).
In addition to these reports, some quick highlights of this fortnight are.
- Calling it a step towards ease of doing business, the Ministry of coal decriminalized 68 provisions and reduced penalties for 10 provisions of Mineral Concession Rules, 1960. A specific clause has been added for the adjustment of any excess or deficient royalties. In addition, the penalty interest rate for late payments of rent, royalties, fees, or other amounts owed to the government has been lowered from twenty-four percent (24%) to twelve percent (12%).
- A new initiative for the elimination of Tuberculosis in India by 2025, ‘Pradhan Mantri TB Mukt Bharat Abhiyaan’ has been launched by President Droupadi Murmu. This is five years ahead of the global goal to eliminate high-burden infectious diseases by 2030.
- A newly created dashboard of the Department of Science and Technology (DST) for national monitoring and feedback to oversee the successful execution of projects, programmes, scholarships, and fellowships financed by DST was launched.
- To eliminate the need for RTO visits, the Ministry of Road Transport and Highways announced the availability of 58 citizen-centric services online. These services, which can be accessed with the aid of Aadhaar identification on a voluntary basis, are connected to driving licenses, conductor licenses, car registration, permits, and transfer of ownership, among other things.
- A new app, ‘SCALE – Skill Certification Assessment for Leather Employees’ has been launched for providing a one-stop solution to enhance the skilling, assessment, and employment needs of the leather industry. It enables access to online live-streamed classes for those interested in leathercraft.
| Report name | National List of Essential Medicines 2022 |
| Sector | Health and Family Welfare |
| Agency responsible | Ministry of Health and Family Welfare |
| Frequency of release | – |
| Source Link | National List of Essential Medicines 2022 |
Brief about the report/data:
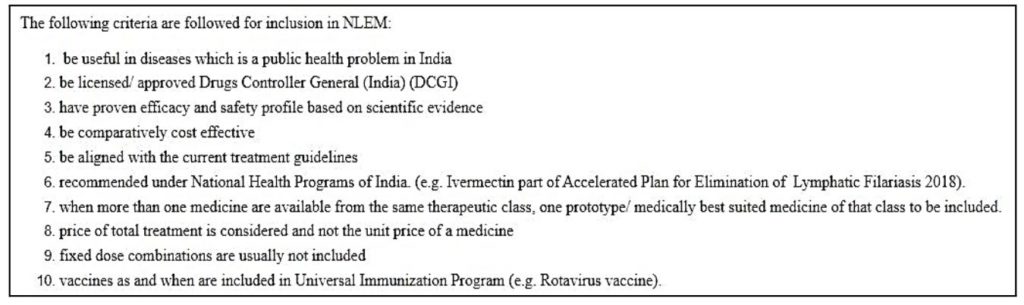
The National List of Essential Medicines (NLEM) is a key dynamic document impacting the health and medical needs of the population. The central aim of this list is to promote the rational use of medicines and ensure their adequate availability. First formulated in 1996, NLEM has undergone revisions in 2003, 2011 and 2015 before the latest revision in 2022. Three key aspects are looked at for consideration in the list – Cost, Safety and Efficacy. Based on these, a drug can be added or removed from the list. The number of medicines included in the 1996 list was 279, 354 in 2003, 348 in 2011, and 376 in 2015. Below are the criteria for making any changes to the list:

Key Highlights:
- A total of 384 drugs categorized in 27 drug classes are included in NLEM 2022. Compared to NLEM 2015, 26 drugs are removed, & 34 new drugs are added to this list.
- Commonly used disinfectant Bleaching powder, and ‘ranitidine’, which is commonly used as a gastrointestinal drug is popular among those removed from NLEM 2022.
- Four major anti-cancer drugs (bendamustine hydrochloride (leukemia), irinotecan HCl Trihydrate (pancreatic cancer), lenalidomide(myeloma), leuprolide acetate (prostate and uterine cancer), Insulin glargine, and anti-diabetic drug ‘teneligliptin’ are among the major ones to be included in NLEM 2022.
| Report name | National Logistics Policy 2022 |
| Sector | Commerce and Industry |
| Agency responsible | Ministry of Commerce and Industry |
| Frequency of release | – |
| Source Link | National Logistics Policy 2022 |
Brief about the policy:
Logistics serve as a bloodline to a nation’s economic development. Logistics form the epicentre of the entire trade- both internal and external. However, the high cost of logistics in India is a serious constraint in competing on a global scale. India’s cost of logistics comes to around 12% of GDP, which is way higher than many developed countries. India has been ranked 44th in the World Bank’s Logistics Performance Index 2018. Therefore, to reduce the costs, and make the entire industry efficient, the National Logistics Policy has been launched.
This is an extensive attempt to address cost and inefficiency by establishing a broad, multi-jurisdictional, cross-sectoral framework for the evolving logistics ecosystem. The government hopes that by implementing this policy, it will be able to reduce the reliance on the road systems for moving goods and explore other possibilities like rail, sea, and air transportation.
Key highlights:
- Four Significant steps under NLP:
- Integration of Digital System (IDS) – Digital integration of seven departments
- Unified Logistics Interface Platform (ULIP) – Real-time exchange of information.
- Ease of Logistics (ELOG) – Promoting accountability and transparency
- System Improvement Group – Constant monitoring of logistic-related projects
- Estimates indicate that the Indian logistics market would increase in value from $160 billion to $215 billion in the following two years. Accordingly, the NLP aims to bring down the cost of logistics from 16% of GDP to an average of 8% by 2030 and make it comparable to the global benchmark.
- NLP also focuses on the employability of the logistics sector. It aims to generate an additional 10-15 million jobs in the logistics ecosystem.
- Focuses on integrating academia and research with industry by creating a Centre of Excellence, and thereby promoting innovation in the logistics sector.
Brief about the report:
India has the second-largest telecommunications ecosystem in the world. Over 4 million people are employed in the telecommunications industry, which accounts for around 8% of the nation’s GDP. The Indian Telegraph Act, of 1885 serves as the foundation for the current regulatory structure for the telecommunications industry. The telecommunications industry had undergone significant changes since then. A solid legal framework is therefore required to ensure the orderly rollout of new communications technologies in the future, while also preserving constitutional and procedural safeguards and keeping in mind the importance of cybersecurity, national security, and public safety.
| Report name | Draft Indian Telecommunication Bill, 2022 |
| Sector | Communications |
| Agency responsible | Ministry of Telecommunications |
| Frequency of release | – |
| Source Link | Draft Indian Telecommunication Bill, 2022 |
Key Highlights:
- The draft bill consolidates three British-era laws: Indian Telegraph Act 1885, Indian Wireless Telegraphy Act 1933, & The Telegraph Wires, (Unlawful Protection) Act 1950.
- Over-the-top (OTT) communication services like WhatsApp, Signal, and Telegram are included under the ambit of telecommunication services, making it mandatory for a government license to conduct business like other telecom companies.
- The Bill stipulates that a user receiving a message sent over telecom services must be aware of the sender’s identity to prevent cyber fraud.
- As per the draft, the assigned spectrum will return to the Centre’s management if a telecom business that is in possession of it experiences bankruptcy or insolvency.
- The proposed legislation would streamline the process for mergers, acquisitions, demergers, & other such types of restructuring “by just needing intimation to the licensing body.”
- The draft bill does away with the provision to obtain views of TRAI before issuing the license to a service provider.
| Report name | Handbook of Statistics of Indian Economy 2021-22 |
| Sector | Economy |
| Agency responsible | RBI |
| Frequency of release | – |
| Source Link | Handbook of Statistics of Indian Economy 2021-22 |
Brief about the report:
Since 1998, a comprehensive database of financial and macroeconomic information has been made available in the yearly “Handbook of Statistics on the Indian Economy.” The Handbook for the year 2021–2022, the 24th in the series, includes 237 statistical tables that cover time series on a variety of variables and indicators related to national income, output, prices, money, banking, financial markets, public finance, foreign trade, the balance of payments, and select socioeconomic indicators at different frequencies.
Key Highlights:
- Indian GDP at constant prices was Rs. 1,13,69,493 Crore in 2015-16, which rose to Rs. 1,47,35,515 Crore in 2021-22. This is slightly higher than the pre-pandemic year 2019-20, valued at Rs. 1,45,15,958 Crore.
- The private final consumption expenditure at constant prices was Rs. 63,91,419 Crore in 2015-16, and Rs. 83,77,854 Crore in 2021-22. The Government’s final consumption expenditure during the same period rose from Rs.11,32,802 Crore to Rs. 15,77,132 Crore. The Government expenditure grew by 39%, while the private sector grew by 31%.
- The Gross Capital formation rose from Rs. 39,17,358 Crore in 2015-16 to Rs. 52,25,982 Crore in 2018-19, thereafter which it fell to Rs. 42,69,909 Crore in 2020-21.
- Household Savings in the form of gold and silver ornaments fell from Rs. 46,532 Crore in 2016-17 to Rs. 38,444 Crore in 2020-21. Savings in physical assets rose from Rs. 15,94,973 Crore in 2016-17 to Rs. 23,09,463 Crore in 2018-19, thereafter which it fell to Rs. 20,48,432 Crore in 2020-21.
- Assets managed under Mutual Funds almost grew by 250% from Rs. 10,82,757 Crore in 2015 to Rs. 37,56,683 Crore in 2022 (provisional).
| Report name | First Advance Estimates of production foodgrains for 2022-23 |
| Sector | Agriculture |
| Agency responsible | Ministry of Agriculture and Farmers Welfare |
| Frequency | – |
| Source Link | First Advance Estimates of production foodgrains for 2022-23 |
Brief about the report:
The advanced estimate of agriculture production presents a detailed estimation of the production of agricultural products in a financial year and its share in the GDP. The data pertaining to the production of major crops including pulses, foodgrains, oilseeds, sugarcane, jute, cotton, etc., are provided in the report. Data from 2008-09 to 2020-21 is available alongside the estimates for 2021-22. The assessment of the production of different crops is based on the data received from States and validated with information available from other sources. This data is useful for deciding on budget allocation and gives an idea of the contribution of this sector to the GDP.
Key Highlights of the report:
- The production of Foodgrains in the country for 2022-23 is estimated at 149.92 million tonnes which is less than the target of 163.15 million tonnes. The production during 2021-22 is higher by 5 million tonnes compared to the previous year’s production.
- Total production of Rice during 2021-22 (fourth advance estimates) is estimated at a record 130.29 million tonnes which is higher than 2020-21’s production by approximately 6 million tonnes.
- Total Pulses production during 2021-22 (fourth advance estimates) is estimated at a record 27.69 million tonnes, 2.23 million tonnes more than 2020-21.
- Total Oilseeds production in the country during 2021-22 (fourth advance estimates) is estimated at a record 37.70 million tonnes which is 1.75 million tonnes more than the production of 35.95 million tonnes during 2020-21.
- Total production of Sugarcane in the country during 2021-22 (fourth advance estimates) is estimated at record 431.81 million tonnes, which is 26.48 million tonnes more than that of 2020-21.
| Report name | Consumer Price Index (CPI) for Rural (R), Urban (U) and Combined (C) for the month of August 2022 (Provisional) |
| Sector | Economy |
| Agency responsible | Ministry of Statistics and Programme Implementation (MoSPI) |
| Frequency | – |
| Source Link | CPI for August 2022 |
Brief about the report:
CPI measures the changes in the price level of goods and services that are consumed in a household. It has a fixed basket of goods and services that includes Food and Beverages; Pan, tobacco, and intoxicants; clothing and footwear; housing; fuel and light, and miscellaneous. Each of these categories has weights assigned to them. Along with this, the Consumer Food Price Index (CFPI) is also measured, which is the change in prices of food products consumed by the population. The base year had been changed from 2010 to 2012 from 2015 onwards and the data is collected from 1181 villages & 1114 urban markets across the country. It is a Laspeyre’s index, which is calculated as, CPI – (Total cost of a fixed basket of goods & services in a particular period*100)/ (Total cost of a fixed basket of goods & services in base period)
Key Highlights of the report:
- The final CPI combined (Rural+ Urban) general rate stood at 6.71% for July-2022, while August-2022’s provisional combined stood at 7.00%. This marks an increase from August-2021’s combined rate of 5.30%.
- The combined CFPI for July-2022 stood at 6.69%, while the provisional CFPI for August-2022 stood at 7.62%. This shows a significant increase from the August-2021 figure of 3.11%.
Significance:
- CPI covers a fixed basket of goods & services that cover all aspects an average Indian household consumes. Therefore, it gives an indication of the cost of living and the currency’s value. The rising level of CPI indicates a growing burden on the pockets of common people.
| Report name | Index of industrial production (IIP) for July 2022 |
| Sector | Economy |
| Agency responsible | NSO, under the Ministry of Statistics and Program Implementation (MoSPI) |
| Frequency of release | Monthly |
| Source Link | Index of industrial production |
Brief about the report:
This index measures the changes in the level of industrial production in a given economy. It indicates the mood of industrial activity in the country. The base year for this index is 2011-12, and it is assigned a value of 100. While the annual survey of industries gives a complete and detailed picture of industrial activity, this index gives a short-term analysis of industrial performance. The data for this index is sourced from 14 different agencies like the Indian Bureau of mines, coffee board, tea board, central electricity authority and others.
For this index, industrial production is categorized into three sectors – Mining (14.3%), Manufacturing (77.6%), and Electricity (7.99%). The values in the brackets denote their relative weights. Alternatively, there is also a ‘use-based’ classification of goods – primary goods (34.05%), capital goods (8.22%), intermediate goods (17.22%), infrastructure goods (12.34%), consumer durables (12.84%), and consumer non-durables (15.33%).
Key Highlights:
- The IIP for June 2022-23 stands at 138.4, which was 122.8 during June 2021-22. The quick estimate for July 2022-23 is 134.6, while that for July 2021-22 is 131.5. Among the sectors, electricity topped with a score of 188.9, followed by manufacturing and mining at 135.2 and 101.1 respectively.
- According to the use-based classification, in quick estimates for July 2022-23, primary goods stood at 131.7, capital goods at 97.8, intermediate goods at 148.9, and infrastructure goods at 150.1. The indices for consumer non-durables stood at 143.0 and that of consumer durables was at 121.5.
- The majority of the goods have shown improvement over the June and July 2021-22 values, with consumer durables also registering a rise.
Significance:
- Stronger IIP indicates the growing demand and recovery of the economy.
| Report name | Wholesale Price Index (WPI) for August 2022 |
| Sector | Economy |
| Agency responsible | Ministry of Commerce and Industry |
| Frequency of release | Monthly |
| Source Link | Wholesale Price Index for August 2022 |
Brief about the index:
It is the average change in the prices of wholesale commodities. The index basket comprises three categories – Primary Articles (117 items, 22.62% of total weight), fuel and power (16 items, 13.15% of total weight) and manufactured products (564 items, 64.23% of total weight). The weights accorded to each category are based on the value of production adjusted for net imports. The base year for this index is 2011-12. It is important to note that WPI does not include services. It focuses on the prices of goods that are traded between the organizations and not on the goods brought by the consumers. WPI is also known as the ‘headline inflation rate’ in India.
Key Highlights:
- The provisional inflation for August-2022 stood at 12.41%, marking an increase from that of August-2021’s 11.64%. The rate of inflation based on the WPI Food Index increased from 9.41% in July 2022 to 9.93% in August 2022.
- Among the categories, the index for the fuel and Power group declined by 4.83%, followed by an increase in the Primary Articles (0.62%), and the Manufacturing products (0.07%) in August 2022 compared to July 2022.
- For the fuel and power group, prices of Mineral Oils (-7.79%) declined in August 2022 compared to July 2022. The increase in prices for manufacturing products is mainly contributed by other non-metallic mineral products, Motor Vehicles, Trailers & Semi-Trailers, Electrical Equipment, Pharmaceuticals, Medicinal Chemical & Botanical Products, Electronic & Optical Products, Machinery & Equipment, Wearing Apparel, etc in August 2022 compared to July 2022.
- Among the Primary Articles, prices of Non-food Articles (1.98%) and Food Articles (1.57%) increased in August 2022 as compared to July 2022. Prices of Minerals (-1.90%) and Crude Petroleum & Natural Gas (-7.34%) declined in August 2022 as compared to July 2022
Significance of the index:
This index provides an estimation of inflation at a wholesale level, providing insight into the prevailing macroeconomic conditions in the country.
| Report name | Payroll Reporting in India: An Employment Perspective – July 2022 |
| Sector | Labour & Employment |
| Agency responsible | NSO, under the Ministry of Statistics and Program Implementation (MoSPI) |
| Frequency of release | Monthly |
| Source Link | Payroll Reporting in India: An Employment Perspective – July, 2022 |
Brief about the data:
The Ministry of Statistics & Programme Implementation started publishing this data in April 2018 covering the period from September 2017 onwards. Information on the number of subscribers under three major schemes- the Employees’ Provident Fund (EPF) Scheme, the Employees’ State Insurance (ESI) Scheme and the National Pension Scheme (NPS) has been used. There could be some overlap in the subscription counts from different sources. As a result, the estimations from different sources do not add up. The data gives different perspectives on the level of employment in the formal sector in the country. However, it does not measure employment at a holistic level.
Key Highlights:
- Over 5.70 crore new subscribers joined the Employees Provident Fund (EPF) scheme between September 2017 and July 2022. About 10.58 lakh new subscribers joined the EPF scheme in July 2022, which is less than 11.08 lakh new subscribers joined in June 2022.
- The data of new members joining EPFO has shown a growing trend since April 2022. Out of 10.58 lakh, new members added, approximately 57.69% are from the age group of 18-25 years of age, showing that first-time job seekers are joining organized sector workforce in large numbers following their education.
- Payroll data analysis by gender reveals that in July 2022, there were 4.06 lakh net new female members. According to enrolment data compared year over year, the number of women joining the workforce increased by 34.84% in July 2022 compared to the same month of the previous year 2021. The percentage of women in the workforce who joined EPFO during this month is 27.54%, the highest in the previous 12 months, suggesting that female involvement in the organised workforce is increasing.
- Between September 2017 and July 2022, 7.08 crore new subscribers joined the Employees State Insurance Corporation scheme. The number of ESI subscribers during July 2022 was 15.72 lakh, up from 15.63 lakh in June 2022.
- Under the NPS Central Government, State Governments and Corporate schemes, 37.19 lakh new subscribers joined the scheme between September 2017 and July 2022.
| Report name | All-India CPI Numbers for Agricultural and Rural Labourers – August 2022 |
| Sector | Labour and Employment |
| Agency responsible | Ministry of Labour & Employment |
| Frequency | – |
| Source Link | All-India CPI Numbers for Agricultural and Rural Labourers – August, 2022 |
Brief about the data:
Since September 1964, the Labour Bureau had been gathering CPI numbers for agricultural labourers. With effect from November 1995, the current series of CPI Numbers for (i) Agricultural and (ii) Rural Laborers (base 1986-87=100) superseded the prior series on base 1960-61=100. The Field Operations Division (FOD) of the National Sample Survey Organization (NSSO) regularly gathers data on prices from 600 sample villages chosen from 20 States each month to compile these index statistics. The CPI-AL/RL is compiled using the methodology recommended by the Technical Advisory Committee on Statistics of Prices & Cost of Living. Although the rural retail prices used in these two series of index values are the same, different weighting diagrams were employed to create these indices.
Key Highlights:
- The All-India Consumer Price Index Number for Agricultural Laborers and Rural Laborers (Base: 1986-87=100) increased by 9 points each for the month of August 2022, reaching 1140 and 1152 points, respectively.
- The increase in the prices of rice, Wheat-Atta, Bajra, Maize, Pulses, Milk, Onion, Chilies Green/Dry, Turmeric whole, mixed spices, Vegetables & Fruits, Gur, etc. was the main factor contributing to the rise in the general index of Agricultural Laborers and Rural Laborers, rising by 7.74 & 7.36 points, respectively.
- The index varied differently in each state. In 20 States, there was a rise of 3 to 15 points for Agricultural Laborers. Himachal Pradesh was at the bottom of the index table with 898 points, while Tamil Nadu was at the top with 1312 points.
- In 20 States, there was a rise of 3 to 17 points for rural labourers. Himachal Pradesh was at the bottom of the index table with 951 points, while Tamil Nadu was at the top with 1301 points.
- Among the states, Jammu & Kashmir and Uttar Pradesh witnessed the largest increases in the Consumer Price Index Numbers for Agricultural Laborers (15 points apiece) and for Rural Laborers (17 points), primarily because of price increases for rice, wheat, vegetables, etc.,
Featured Image: Government Data Roundup